magento / magento2

Prior to making any Submission(s), you must sign an Adobe Contributor License Agreement, available here at: https://opensource.adobe.com/cla.html. All Submissions you make to Adobe Inc. and its affiliates, assigns and subsidiaries (collectively “Adobe”) are subject to the terms of the Adobe Contributor License Agreement.
http://www.magento.com
Open Software License 3.0
11.54k stars 9.32k forks source link

Product Page Product Images Slow to Load #14667

Closed chattertech closed 5 years ago

chattertech commented 6 years ago

Preconditions

  1. Running on a very fast Magento centric server (MageMojo)
  2. Magento 2.2.3, PHP 7.026, MYSQL 5.6.35-80.0

Steps to reproduce

  1. Clean setup of Magento 2.2.3 via composer
  2. Imported products and created new products
  3. Used both Magento Luma and Ultimo Themes
  4. Images are 500x500 or similar jpegs and properly compressed
  5. Same behaviour in all modes
  6. Same behaviour with Magento cache and Varnish cache

Expected result

  1. Product image should open very quickly with page (same exact page and images open instantly on same server on Magento V1.9.3)

Actual result

  1. All pages are opening very fast however,
  2. Product image/images take 2-4s to load with spinning loader icon before image shows

magento-2-slow-image-load-screenshot

AirmanAJK commented 6 years ago

I've noticed this as well. I suspect it's because of Magento 2's heavy use of requireJS. All of the many "x-magento-init" and "data-mage-init" parts need to be executed, and the gallery.js code doesn't seem to be very quick anyway.

It would be nice if the primary image was shown instead of a spinner, since that could simply be an tag on the page.

subbu-d commented 6 years ago

Yes, I have noticed the same issue as it took more time to load the product's primary image.

utklasad commented 6 years ago

Same issue here even if the source file of the picture is just 400kb. I've not noticed this before so it might be an issue with the latest version of Magento 2.2?

I will try to debug the code to find out where the bottleneck is.

Ylmzef commented 6 years ago

Same here!

utklasad commented 6 years ago

The issue is definitely related to Chrome.

seanspcm commented 6 years ago

did anyone find a solution to the product images loading slow on the product pages?

dankoz51 commented 6 years ago

I have been looking for a solution to this, let me know if anyone comes up with something otherwise its will be a few weeks before i get back to it

harrigo commented 6 years ago

Has anyone noticed with this that if you flush the browser cache the problem goes away?

For me at least, flushing my cache in chrome leads to images loading in less than a second (rather than 4+ seconds) and am unsure how to get the problem to come back. It will however come back as it has the past few times.

dankoz51 commented 6 years ago

Ok so this issue is simply how the loader is designed, I have outlined why this is in the blog post. https://xumulus.com/kill-the-loader-how-to-improve-your-magento-2-product-page-load-time/

There is also a solution provided in a GitHub project

uk28881785 commented 6 years ago

Which Magento mode are you using? This could also have an effect....

harrigo commented 6 years ago

Thanks Dankoz, I am halfway deciding to use Magic Zoom as after testing it seems a far bit better however that blog post looks interesting and may reconsider.

It's happening for me in production mostly with bundling and merging on however is not great in either mode. The problem seems to occur after a while of not flusing client cache tho and in dev i disable that most the time on browser so wouldn't notice it. When this goes slow on one occasion ive seen it take a few mins and eating all the ram until i flushed the cache. Think i have only seen this on chrome so far however.

chattertech commented 6 years ago

Thanks Dankoz!

I read your blog and it is an excellent explanation of this behaviour. Surprised that this issue has not been addressed by Magento themselves yet. ( I haven't tried V2.2.5 yet )

I will try the fast page load module you suggest.

Johan-Trp commented 6 years ago

I can confirm this is also happening for us, M EE 2.2.4. Upon loading a product detail page, we see the fotorama spinning icon and for some people, it takes extremely long before the image is shown. According to the Chrome Network tab, banner/ajax/load/?sections hangs, I've seen myself for as much as 13 seconds, before the image displays. The header on the image says it's eventually fetched from browser cache with status 200. So that shouldn't be delayed at all.

As harrigo mentioned, as soon as you flush the browser cache, then reload the product detail page, you barely see the spinner, the image is there near instantly.

Dankoz51's solution may well make the first product image display faster, by removing the spinner, but I'm concerned this may not actually fix this degrading performance of the AJAX call. We might just not notice it as much anymore, but should still strive to find out why the performance of that AJAX call is negatively impacted by a filled up browser cache.

ladle3000 commented 6 years ago

@chattertech I updated to 2.2.5 and I don't see any improvement in the image loading as advertised. This shouldn't still be a lingering issue since 2016. Pretty fucking ridiculous to be honest.

chattertech commented 6 years ago

I tried Dankoz51's solution at https://github.com/xumulus/magento2-fast-product-images. It does indeed make the initial image load much faster. However the rest of the page is then delayed and stalls by the same amount that the image was spinning before.

Like Johan-Trp said there is a major issue delaying product page renders. There is no delay in category or CMS pages btw.

Also this is not just a Chrome issue as i see a delay in Safari and Firefox as well. They are a bit faster but still very noticeable.

dankoz51 commented 6 years ago

That problem has to do with sessions and php locking and how it’s really bad in php to have many Ajax call backs using the same session, the product page contains more than other pages hence the issue.

I have some notes in my blog post but I think it’s probably the subject of another post all together.

Php uses read locks on request so it will wait sequentially for requests that are made from the browser in parrallel. Magento need to mark and enable some sort of read only method for its Ajax requests

If you are using redis sessions try disabling locking and see if the page loads better. I am not sure what else that may break but it would be an interesting test, if I am correct you will see a dramatic improvement.

On Thu, Jul 12, 2018 at 10:28 PM chattertech notifications@github.com wrote:

I tried Dankoz51's solution at https://github.com/xumulus/magento2-fast-product-images. It does indeed make the initial image load much faster. However the rest of the page is then delayed and stalls by the same amount that the image was spinning before.

Like Johan-Trp said there is a major issue delaying product page renders. There is no delay in category or CMS pages btw.

Also this is not just a Chrome issue as i see a delay in Safari and Firefox as well. They are a bit faster but still very noticeable.

— You are receiving this because you commented. Reply to this email directly, view it on GitHub https://github.com/magento/magento2/issues/14667#issuecomment-404715093, or mute the thread https://github.com/notifications/unsubscribe-auth/ACQg82F5gIHtZqCcDhC9TrOO6mMFO6z4ks5uGBPSgaJpZM4TR_eK .

ladle3000 commented 6 years ago

Any new updates to this issue. I tried @dankos51 solution but didn't seem to do anything in my case.

dankoz51 commented 6 years ago

Did you make sure it was enabled in the admin, it installs disabled by default On Sun, Jul 22, 2018 at 9:42 AM Scott Noroozi notifications@github.com wrote:

Any new updates to this issue. I tried @dankos51 solution but didn't seem to do anything in my case.

— You are receiving this because you commented. Reply to this email directly, view it on GitHub https://github.com/magento/magento2/issues/14667#issuecomment-406871641, or mute the thread https://github.com/notifications/unsubscribe-auth/ACQg8wDIvtsjhOD4POXH3CyhE9q7LRgJks5uJI9sgaJpZM4TR_eK .

harrigo commented 6 years ago

Dankoz's module is an improvement it atleast looks like the page loads fast so thanks a lot for that. I will also keep using it even if fotorama does speed up as would rather see the image than a loading spinning wheel. With mine however scrolling and java script becomes jumpy while fotorama is still loading. Don't think it will be possible to hide this unless we actually fix it.

@dankoz51 the Redis locking idea sounds interesting but why would this be affected by a client cache flush? Is this the 'disable_locking' => '1' part of the redis config for sessions in env.php? I will test this but need the problem to resurface on a computer for me first and i wont flush the cache this time.

ladle3000 commented 6 years ago

@dankoz51 Thanks, that was the issue. Appreciate the extension.

ghost commented 6 years ago

Hi @chattertech I'm tested but, the image load fastly, see attachments, frame- 43d

harrigo commented 6 years ago

@engcom-backlog-nazar It doesn't always load slow and this is why this is going to be very difficult to debug. Once it does start loading slow it will load incredibly slow on that client PC until cache is flushed.

siliconalchemy commented 6 years ago

@engcom-backlog-nazar It's heavily dependent on browser CPU speed - on slower/older computers/devices it's very, very bad - up to 45 seconds on an older desktop in my case. Try using Chrome Developer tools to throttle your CPU (Developer Tools -> Performance -> CPU -> Throttle -> 6x or slowest setting).

siliconalchemy commented 6 years ago

This is the same issue that celebrated it's second birthday yesterday which was stupidly closed by @guz-anton and has thus languished ever since: https://github.com/magento/magento2/issues/6018 This is a terrible, terrible bug in Magento frontend, I'm sure a lot of people would really appreciate it if you took it seriously and looked into it. Thank you!

chattertech commented 6 years ago

@engcom-backlog-nazar thanks for the attachment. However i have a very fast computer and 250Mbps fibre connection and a highly optimized cache on the server end and i still experience slow loads. As noted in the initial post, the same exact page and image opens instantly on same server on Magento V1.9.3.

As others have noted the behaviour is somewhat browser dependant and other factors such as age of client browser cache factor in. However we cannot expect users to clear their cache for a particular website acting slowly.

I am not sure how to capture a website in GIF format as you have done. If you can let me know the method for that i can post the same page in M1 and M2 to show you the huge difference in image load speed.

Considering that the product page is one of most important parts of an e-commerce site, and site speed is also very important for sales and SEO, i believe this requires addressing.

zestbeauty commented 6 years ago

Please, please can someone fix this, its killing my sales!!!

zestbeauty commented 6 years ago

This what google see's:

screen shot 2018-08-06 at 19 09 10
chattertech commented 6 years ago

I actually think this may be the most serious bug that needs fixing in M2 asap.

brekz commented 6 years ago

Yes, problem is with browser session/cache.

When you (browser) having long session of that page, gallery struggles a lot: https://www.dropbox.com/s/uu62u8aj28dysaa/galleryissuee.mov?dl=0 and you can see when I opening with incognito - gallery loads faster.

chattertech commented 6 years ago

brekz, I would say the problem exists even in incognito but is made much worse by cache/session storage issue. The same images in an M1 site open instantly, no spinner at all in a fresh browser or not. I am seriously considering moving back to Magento 1 or to Shopify. Besides annoying customers, this effects SEO ranking.

ladle3000 commented 6 years ago

Just install the module in this thread.

On Sun, Aug 12, 2018, 5:45 PM chattertech notifications@github.com wrote:

brekz, I would say the problem exists even in incognito but is made much worse by cache/session storage issue. The same images in an M1 site open instantly, no spinner at all in a fresh browser or not. I am seriously considering moving back to Magento 1 or to Shopify. Besides annoying customers, this effects SEO ranking.

— You are receiving this because you commented. Reply to this email directly, view it on GitHub https://github.com/magento/magento2/issues/14667#issuecomment-412373943, or mute the thread https://github.com/notifications/unsubscribe-auth/ACQbJdLKenaOgcmCIRUuE5BX-YcF5sVSks5uQKIPgaJpZM4TR_eK .

chattertech commented 6 years ago

Thanks for the suggestion snoroozi. I have installed it and the first image loads much more quickly but the rest of the page still stalls by the same amount as the spinner takes to complete loading pre-module. (Cannot scroll on page etc until the loading finishes)

It does not solve the problem but at least does make it appear better.

It is really a strange issue with product pages only because category pages with dozens of images load instantly as expected. Perhaps it is an issue with loading of tabs and/or related products.

AirmanAJK commented 6 years ago

It isn't "strange". The gallery is based off of a javascript extension that needs to be initialized through RequireJS along with a million other dependencies queued up on the page.

The category page just has plain image tags. Nothing special has to load.

chattertech commented 6 years ago

OK i get that AirmanAJK. But why was the same exact page in M1 fully loaded instantly?

AirmanAJK commented 6 years ago

Magento 1 didn't use RequireJS. I've found it very powerful, but wow does it slow things down client-side. All of the init scripts need to be loaded and executed and there's so many of them. It's done in order as well, so the gallery init script is probably far down.

I understand why they did it from a design perspective, but it came with a hefty penalty.

ladle3000 commented 6 years ago

Honestly, the js loads quickly on my site with the module. I don't usually post my site, but you can see a simple product here with varnish running https://thegreennursery.com/grovia-bioliners-cloth-diaper-liners.html On Sun, Aug 12, 2018, 7:16 PM AirmanAJK notifications@github.com wrote:

Magento 1 didn't use RequireJS. I've found it very powerful, but wow does it slow things down client-side. All of the init scripts need to be loaded and executed and there's so many of them. It's done in order as well, so the gallery init script is probably far down.

I understand why they did it from a design perspective, but it came with a hefty penalty.

— You are receiving this because you commented. Reply to this email directly, view it on GitHub https://github.com/magento/magento2/issues/14667#issuecomment-412378538, or mute the thread https://github.com/notifications/unsubscribe-auth/ACQbJWMFCVp5BDDEodGKeNPbHjt-PA2Kks5uQLc8gaJpZM4TR_eK .

AirmanAJK commented 6 years ago

Varnish is irrelevant here as that's only server-side delivery. And any decent computer is going to chug through all that JS very quickly. It's mostly noticeable on mobile. Your site did seem fine on my phone though.

One unrelated small suggestion: use the "redirect to cart page after adding product" option. Our conversions had a noticeable increase after we used that. Some people find the minicart confusing.

ladle3000 commented 6 years ago

I wasn't implying varnish was loading js, only that the initial site loads quickly because of cache.

We have used both settings over the years in regards to cart, but to me it seems more current to not redirect to cart... amazon, etc. Wish there was a way to A/B test that reliably.

On Sun, Aug 12, 2018 at 8:34 PM AirmanAJK notifications@github.com wrote:

Varnish is irrelevant here as that's only server-side delivery. And any decent computer is going to chug through all that JS very quickly. It's mostly noticeable on mobile. Your site did seem fine on my phone though.

One unrelated small suggestion: use the "redirect to cart page after adding product" option. Our conversions had a noticeable increase after we used that. Some people find the minicart confusing.

— You are receiving this because you commented. Reply to this email directly, view it on GitHub https://github.com/magento/magento2/issues/14667#issuecomment-412382759, or mute the thread https://github.com/notifications/unsubscribe-auth/ACQbJYo6h5zUMbLrX31uGlqb72EoVgimks5uQMmAgaJpZM4TR_eK .

Johan-Trp commented 6 years ago

To quantify the problem, I've started measuring the issue with Tag Manager and GA User Timings. If more of you do this, we can put the problem in perspective by quantifying it.

In Tag Manager you make:

Trigger, name: 'PDP First Product Visible' with type Element Visibility, Selection Method: CSS Selector on element img.fotorama__img (depends on your theme perhaps, find with right-click inspect on the main image), once per page, say 40% visibility (small enough so it is instantly visible, not depending on scroll). Tick 'Observe DOM Changes'. Depending on your setup, try and fire this trigger only on product detail pages, you probably have something to filter on that already.

Then you make a variable called 'dataLayer GTM Start Timestamp' of the type Data Layer Variable and you type in 'gtm.start' as the Data Layer Variable Name This is the start time against which we measure.

Another Tag called 'Visibility Timer End dL Push' with Custom HTML code:

<script> var timeEnd = Date.now(); var timeDiffMs = timeEnd - {{dataLayer GTM Start Timestamp}}; var timeDiffS = timeDiffMs / 1000; dataLayer.push({event: 'productImageVisible', 'loadTime' : timeDiffS}); dataLayer.push({ 'event': 'GATiming', 'timingCategory': 'PDP Main Image', 'timingVar': 'Load Time', 'timingLabel': 'M2 PDP Spinner Bug', 'timingValue': timeDiffMs }); </script>

This is triggered by the above-mentioned trigger.

This pushes the time in seconds to the dataLayer so in GTM preview you can see it right away. In Milliseconds it prepares it to be sent to GA as a User Timing.

Now you need another bunch of variables, all Data Layer Variables with these Name/DL Var pairs: 'dataLayer - timingCategory' / timingCategory 'dataLayer - timingLabel' / timingLabel 'dataLayer - timingValue' / timingValue 'dataLayer - timingVar' / timingVar

These we use to populate the GA User Timing tag we'll make next. Tag Name: 'Google Analytics Timing Generic' Type: Google Analytics - Universal Analytics Track Type: Timing Var: {{dataLayer - timingVar}} Category: {{dataLayer - timingCategory}} Value: {{dataLayer - timingValue}} Label: {{dataLayer - timingLabel}}

Be sure to override settings and add your GA Tracking ID.

Trigger this Tag by a new Custom Event you make called 'Timing - GATiming' with event name GATiming, firing on all custom events.

Now you'll see in GTM Preview with Google Tag Assistant that you get user timing hits sent. Publish when happy. After a few hours you'll see in GA under Behaviour > Site Speed > User Timings that they start coming in.

For us, the average hovers around 7 seconds. In contrast to what we see under Behaviour > Site Speed > Overview where we get 1.95s page load time on average. So the page is long finished, then this stupid image decides to finally show up. Needless to say, the time for the PDP main image to show should be shorter than the page load time.

Please do the above or similar and post your findings. Do note Google Analytics' sampling rates: https://developers.google.com/analytics/devguides/collection/analyticsjs/user-timings

ladle3000 commented 6 years ago

It's the js

On Thu, Aug 16, 2018, 3:42 AM Johan T. notifications@github.com wrote:

To quantify the problem, I've started measuring the issue with Tag Manager and GA User Timings. If more of you do this, we can put the problem in perspective by quantifying it.

In Tag Manager you make:

Trigger: PDP First Product Visible with type Element Visibility, Selection Method: CSS Selector on element img.fotorama__img (depends on your theme perhaps), once per page, say 40% visibility (small enough so it is instantly visible, not depending on scroll). Depending on your setup, try and fire this trigger only on product detail pages, you probably have something to filter on that already.

Then you make a variable called 'dataLayer GTM Start Timestamp' of the type Data Layer Variable and you type in 'gtm.start' as the Data Layer Variable Name This is the start time against which we measure.

Another Tag called 'Visibility Timer End dL Push' with Custom HTML code:

This is triggered by the above-mentioned trigger.

This pushes the time in seconds to the dataLayer so in GTM preview you can see it right away. In Milliseconds it prepares it to be sent to GA as a User Timing.

Now you need another bunch of variables, all Data Layer Variables with these Name/DL Var pairs: 'dataLayer - timingCategory' / timingCategory 'dataLayer - timingLabel' / timingLabel 'dataLayer - timingValue' / timingValue 'dataLayer - timingVar' / timingVar

These we use to populate the GA User Timing tag we'll make next. Tag Name: 'Google Analytics Timing Generic' Type: Google Analytics - Universal Analytics Track Type: Timing Var: {{dataLayer - timingVar}} Category: {{dataLayer - timingCategory}} Value: {{dataLayer - timingValue}} Label: {{dataLayer - timingLabel}}

Be sure to override settings and add your GA Tracking ID.

Trigger this Tag by a new Custom Event you make called 'Timing - GATiming' with event name GATiming, firing on all custom events.

Now you'll see in GTM Preview with Google Tag Assistant that you get user timing hits sent. Publish when happy. After a few hours you'll see in GA under Behaviour > Site Speed > User Timings that they start coming in.

For us, the average hovers around 4 seconds. In contrast to what we see under Behaviour > Site Speed > Overview where we get 1.95s page load time on average. So the page is long finished, then this stupid image decides to finally show up. Needless to say, the time for the PDP main image to show should be shorter than the page load time.

Please do the above or similar and post your findings. Do note Google Analytics' sampling rates: https://developers.google.com/analytics/devguides/collection/analyticsjs/user-timings

— You are receiving this because you commented. Reply to this email directly, view it on GitHub https://github.com/magento/magento2/issues/14667#issuecomment-413455389, or mute the thread https://github.com/notifications/unsubscribe-auth/ACQbJXvur--Za7hdJMagc5tKBROkIHkNks5uRSJVgaJpZM4TR_eK .

Johan-Trp commented 6 years ago

After over 50K user timing samples, we can see some patterns in mobile vs desktop and by browser:

50k-samples-by-device-and-browser

The average has been creeping up considerably and worryingly. Chrome desktop is an absolute shocker with average main image load time of over 1 minute.

Bots and internal users are filtered out of this. It's extremely high so I'm wondering whether my recording method has holes in it. On a development server we've applied a patch and there the same recording method now records 450-550ms timings, something we're looking to push live the coming days. I'm not sure which patch they've applied, if it works well on production, I'll try and find out.

chattertech commented 6 years ago

Thanks Johan-Trp for quantifying the issue.

I have installed the BSS DeferJavascipt module and the Dankoz51 Fast Product Image extension and product pages are now the same speed as M1. However this performance should really be built in to Magento. It took a lot of time, research and testing to finally have what should be default performance.

Don't want to push a site but please see the following page to view the almost instant load speed now with the 2 above mentioned modules installed. (I haven't addressed the issue yet of image and text layering added by the Fast Product Image module.)

https://pondsonline.ca/proeco-products-floating-fountain-ff-8000.html

ghost commented 6 years ago

Hi @chattertech , thank you for your report. We've acknowledged the issue and added to our backlog.

Johan-Trp commented 6 years ago

Glad to see this is now getting the much desired attention it clearly deserves, thanks!

My recordings are showing a stable trend on mobile, but on desktop things have gotten very bad since last Sunday. Given te fact nothing gets published on Sunday, perhaps Magento's own cache plays a part in this.

screen shot 2018-08-20 at 16 00 12 screen shot 2018-08-20 at 16 00 31

I did think of one way my recordings are off. If it takes quite long for the PDP Main Image to load, they may scroll past it, with the spinner going out of view. As the recording is based on item visibility, the timer won't stop until they scroll back up at some point. Then it's not a fair representation of how long it took to load, but of how long it took to become viewed instead.

Still, this is trend data that gives at least some insight. After the patch our devs decided upon goes live, I'll post some updates.

Chrome desktop and Samsung's mobile browser remain the outliers. There's something about those that make this issue much worse for those user agents.

DrewML commented 6 years ago

Hey all. Your friendly neighborhood Magento JS dev here 👋. I'd love to get this issue addressed.

I did some performance profiling on a demo store to add some concrete data to this discussion.

Trace Details

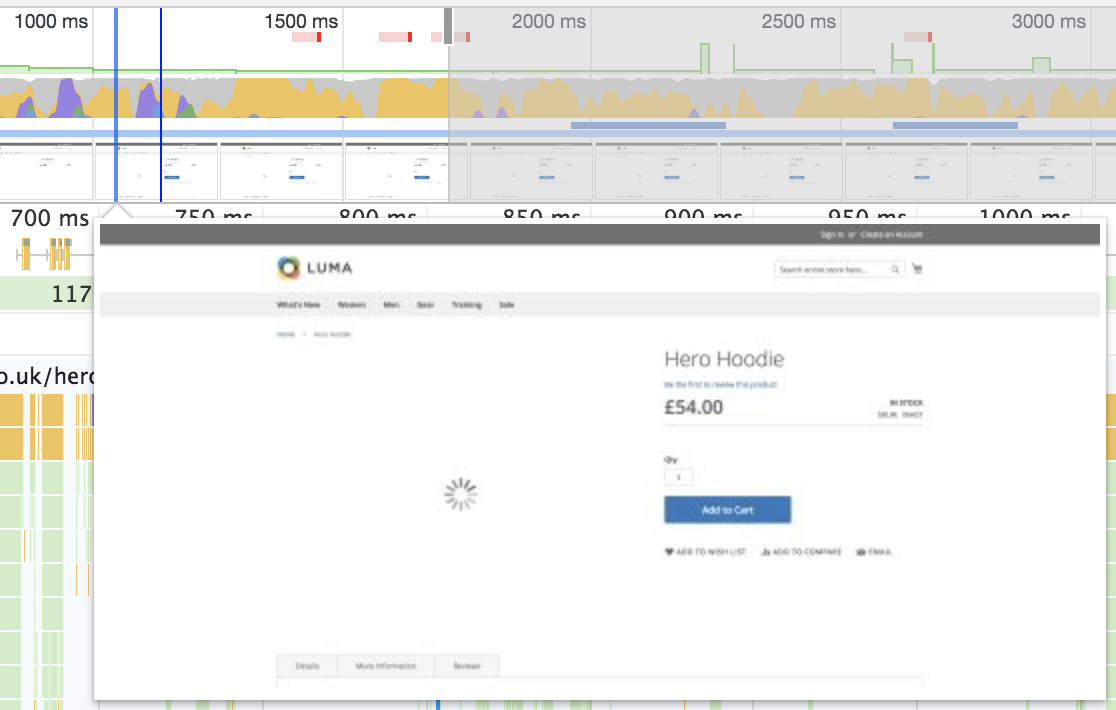
Full render without product photos - just over 1s image

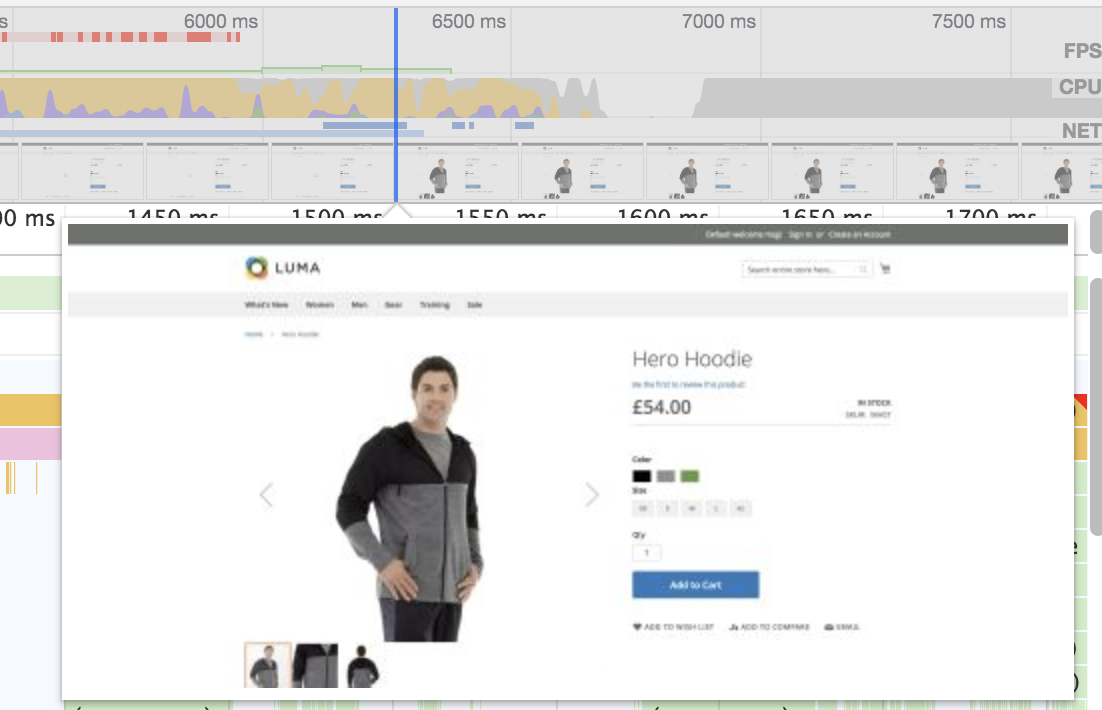
Product Photos rendered - around 6.4s image.

Why the slowness @dankoz51 is correct that this has to do with JavaScript execution and how the mage-init loader works in Magento 2. There are a few problems that add up to the problem we're seeing:

  1. data-mage-init and text/x-magento-init are not processed until the document is completely ready. There are places where the DOM needed for these operations is already ready, so we have an artificial slowdown

  2. mage-init scripts have no concept of priority or load order. After they're scraped from the DOM, a require call is made in a loop to fetch each dependency. The order of execution ends up becoming a race: whichever AMD module finishes loading the quickest, evaluates first. Because of the single-threaded nature of JS, some lower-priority mage-init scripts will end up hogging the thread and pushing out the time for Fotorama to begin its evaluation.

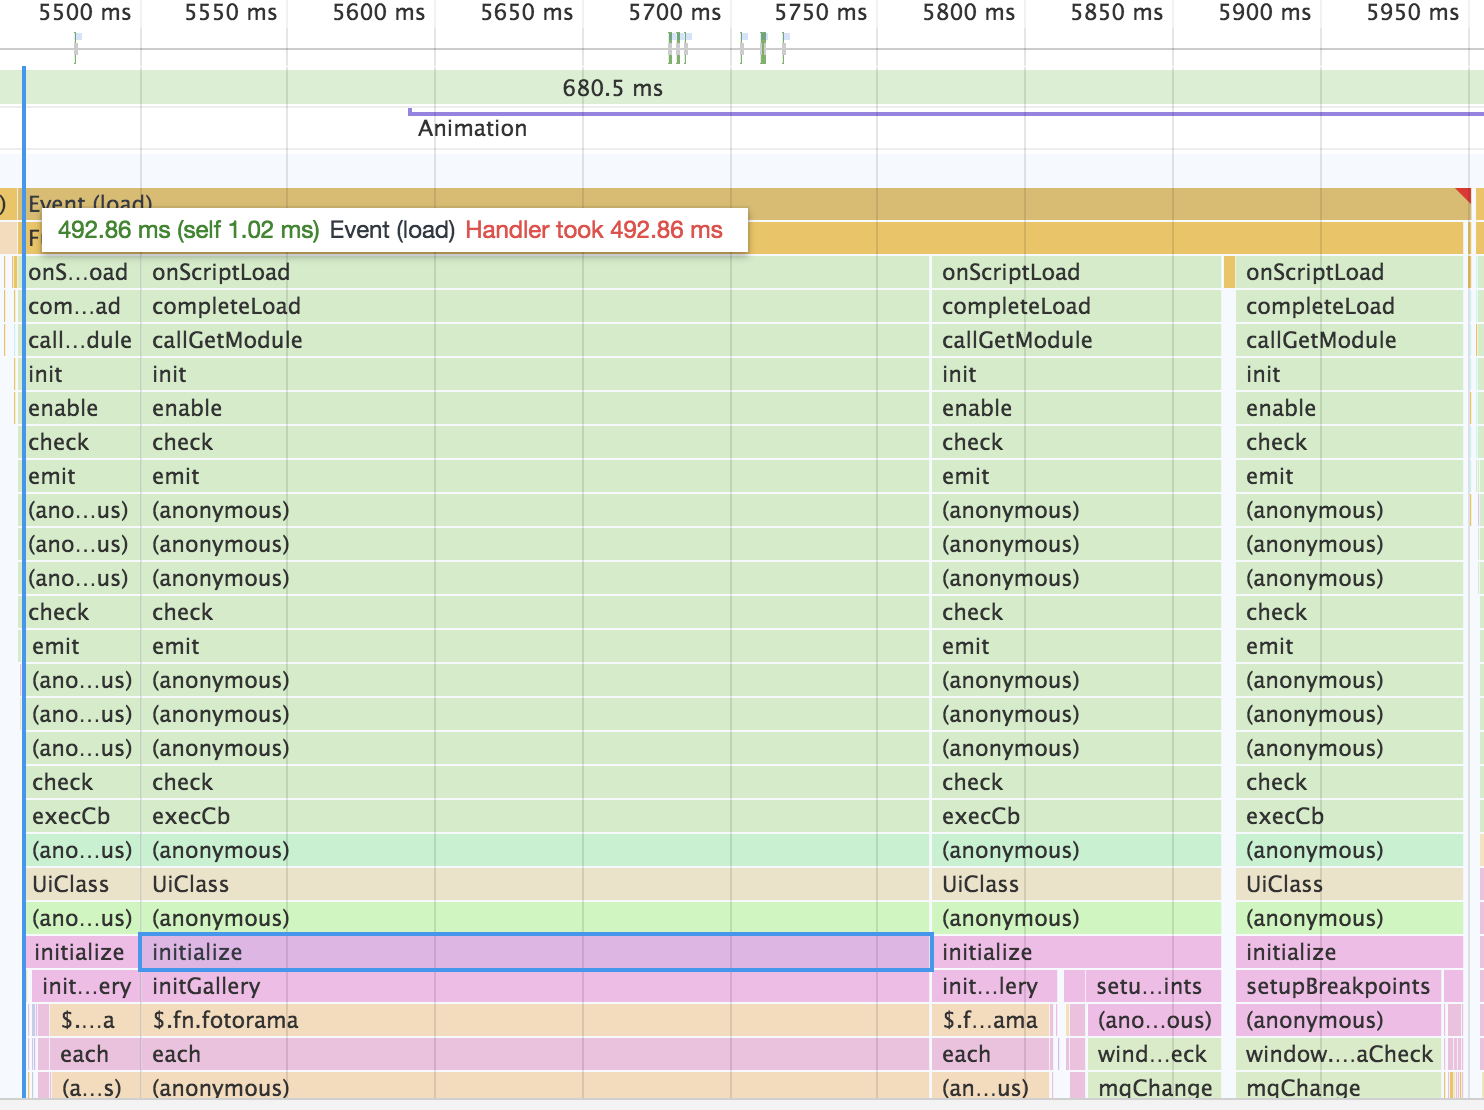
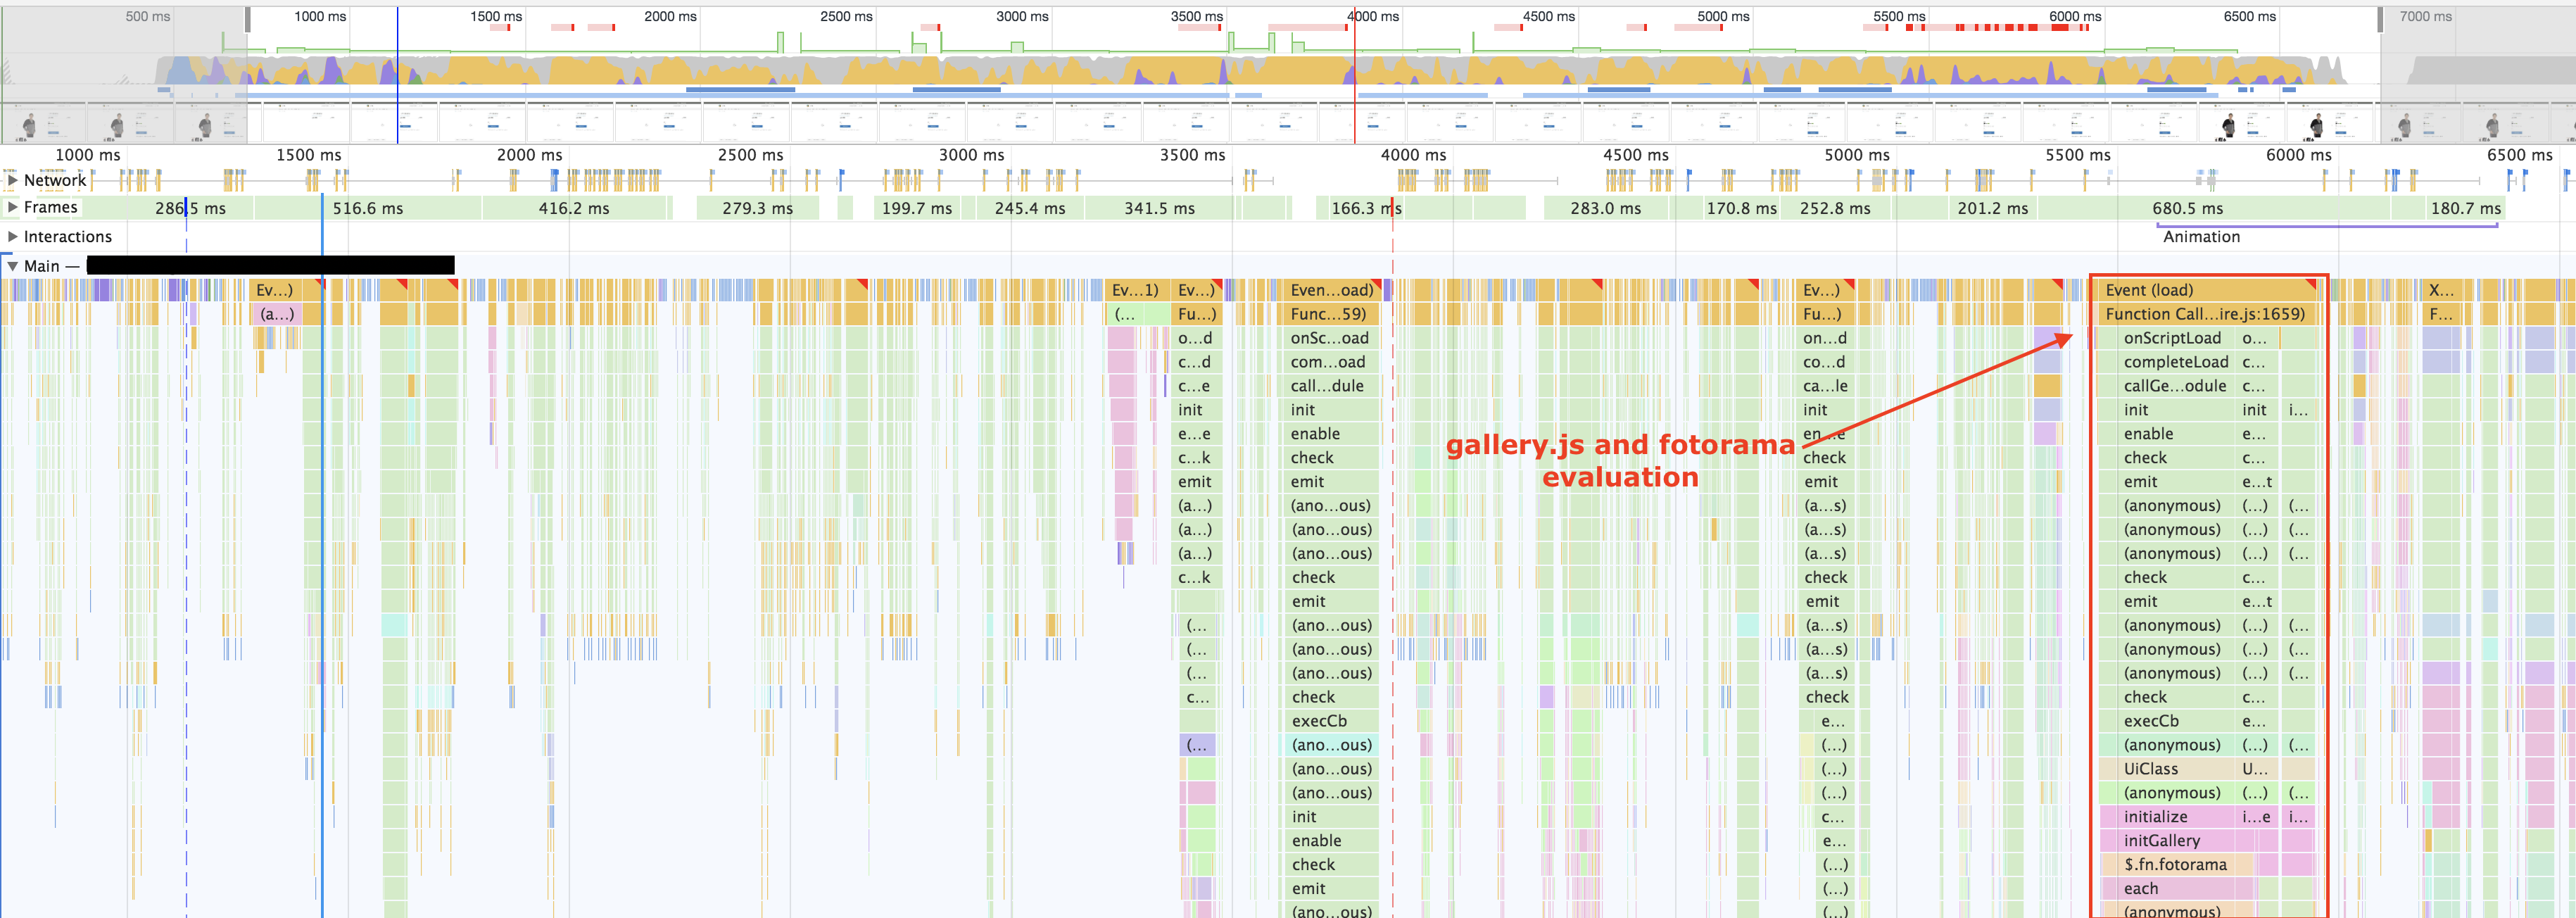
  3. The gallery.js and Fotorama evaluation happen to be the most expensive JS on the product page out of the box. In this trace, it takes half a second for all of it to evaluate image image

Possible Solutions

  1. Add a concept of priorities to the mage-init loader so a developer can add hints as to which widgets should get CPU time first (typically above the fold content). This is a decent chunk of work that would require design and planning to get right.

  2. Switch gallery.js and Fotorama from the declarative mage-init initialization to imperative initialization from a JS module, so there is better control over when execution happens during page load

  3. Server render the <img /> tag for the primary product photo, and upgrade the DOM to use Fotorama during page boot on the client-side.

I'm leaning towards a combination of 2 and 3 to address this issue, and then looking into 1 as a better long-term solution. Would love to hear input from those of you dealing with this issue in production, and then we'll decide on a plan of attack.

pemann commented 6 years ago

My 2 cents:

Browser: Chrome Magento: 2.2.x

If I have a lot of data in localstorage then there is a browser freeze between initial page load and loading of gallery and recently viewed data. Chrome call tree timings show that most of the time is spent adding and updating items in localstorage. JS heap is constantly full and needs GC. CPU usage shows 100%.

If I clear the localstorage, then loading of gallery and recently viewed is fast.

chrome-call-tree-m2-product-page

chrome-call-tree-m2-product-page-2

pemann commented 6 years ago

Actually that storage problem I described is related to recently viewed products. If I have a lots of them, browser will freeze because of intensive storage writing and reading.

pemann commented 6 years ago

Might be related to https://github.com/magento/magento2/issues/17813

Johan-Trp commented 6 years ago

Hey all. Your friendly neighborhood Magento JS dev here 👋. I'd love to get this issue addressed.

Thanks for the comprehensive front-end dev perspective analysis. As above pemann found out, this problem gets worse when the client side cache starts building up. To get this into the complete picture, can you please analyse this part as well? Why is it that the already poor performance degrades when the browser cache fills up? The answer might affect your otherwise sound proposals.

For me, the PDP main image is so important for all sorts of reasons and KPI's, I'd rather not leave it to client-side 'chance' how/when it's rendered. Getting the first one to sent from the server makes total sense. Any further images can then indeed be loaded through client-side logic. Solution 3 for me on the short term, pretty please kind people at Adobe/Magento/in this community.

DrewML commented 6 years ago

Thanks for the input @Johan-Trp. The local storage stuff is kind of related to this (it makes the problem worse). Any slow code that runs in the main thread before gallery.js initialization is going to push out the time to rendering of the first photo. re: #17813, I'd love to keep the discussion confined there, but I will confirm I've seen this be a serious bottleneck on some popular sites I've profiled. We're hammering localStorage in a loop, which isn't helping.