marcomusy / vedo

A python module for scientific analysis of 3D data based on VTK and Numpy
https://vedo.embl.es
MIT License
2.03k stars 264 forks source link

How can I show edges in a VTU mesh? #380

Closed XushanLu closed 3 years ago

XushanLu commented 3 years ago

I am trying to use vedo to plot an unstructured 3D surface mesh and here's what I did: from vedo import load, show surf_mesh = load('surface_mesh_with_topo.vtu) show(surf_mesh)

And here's what was plotted: image

As you can see, there is not a single edge shown here. The following screenshot shows how the mesh looks like in Paraview: image

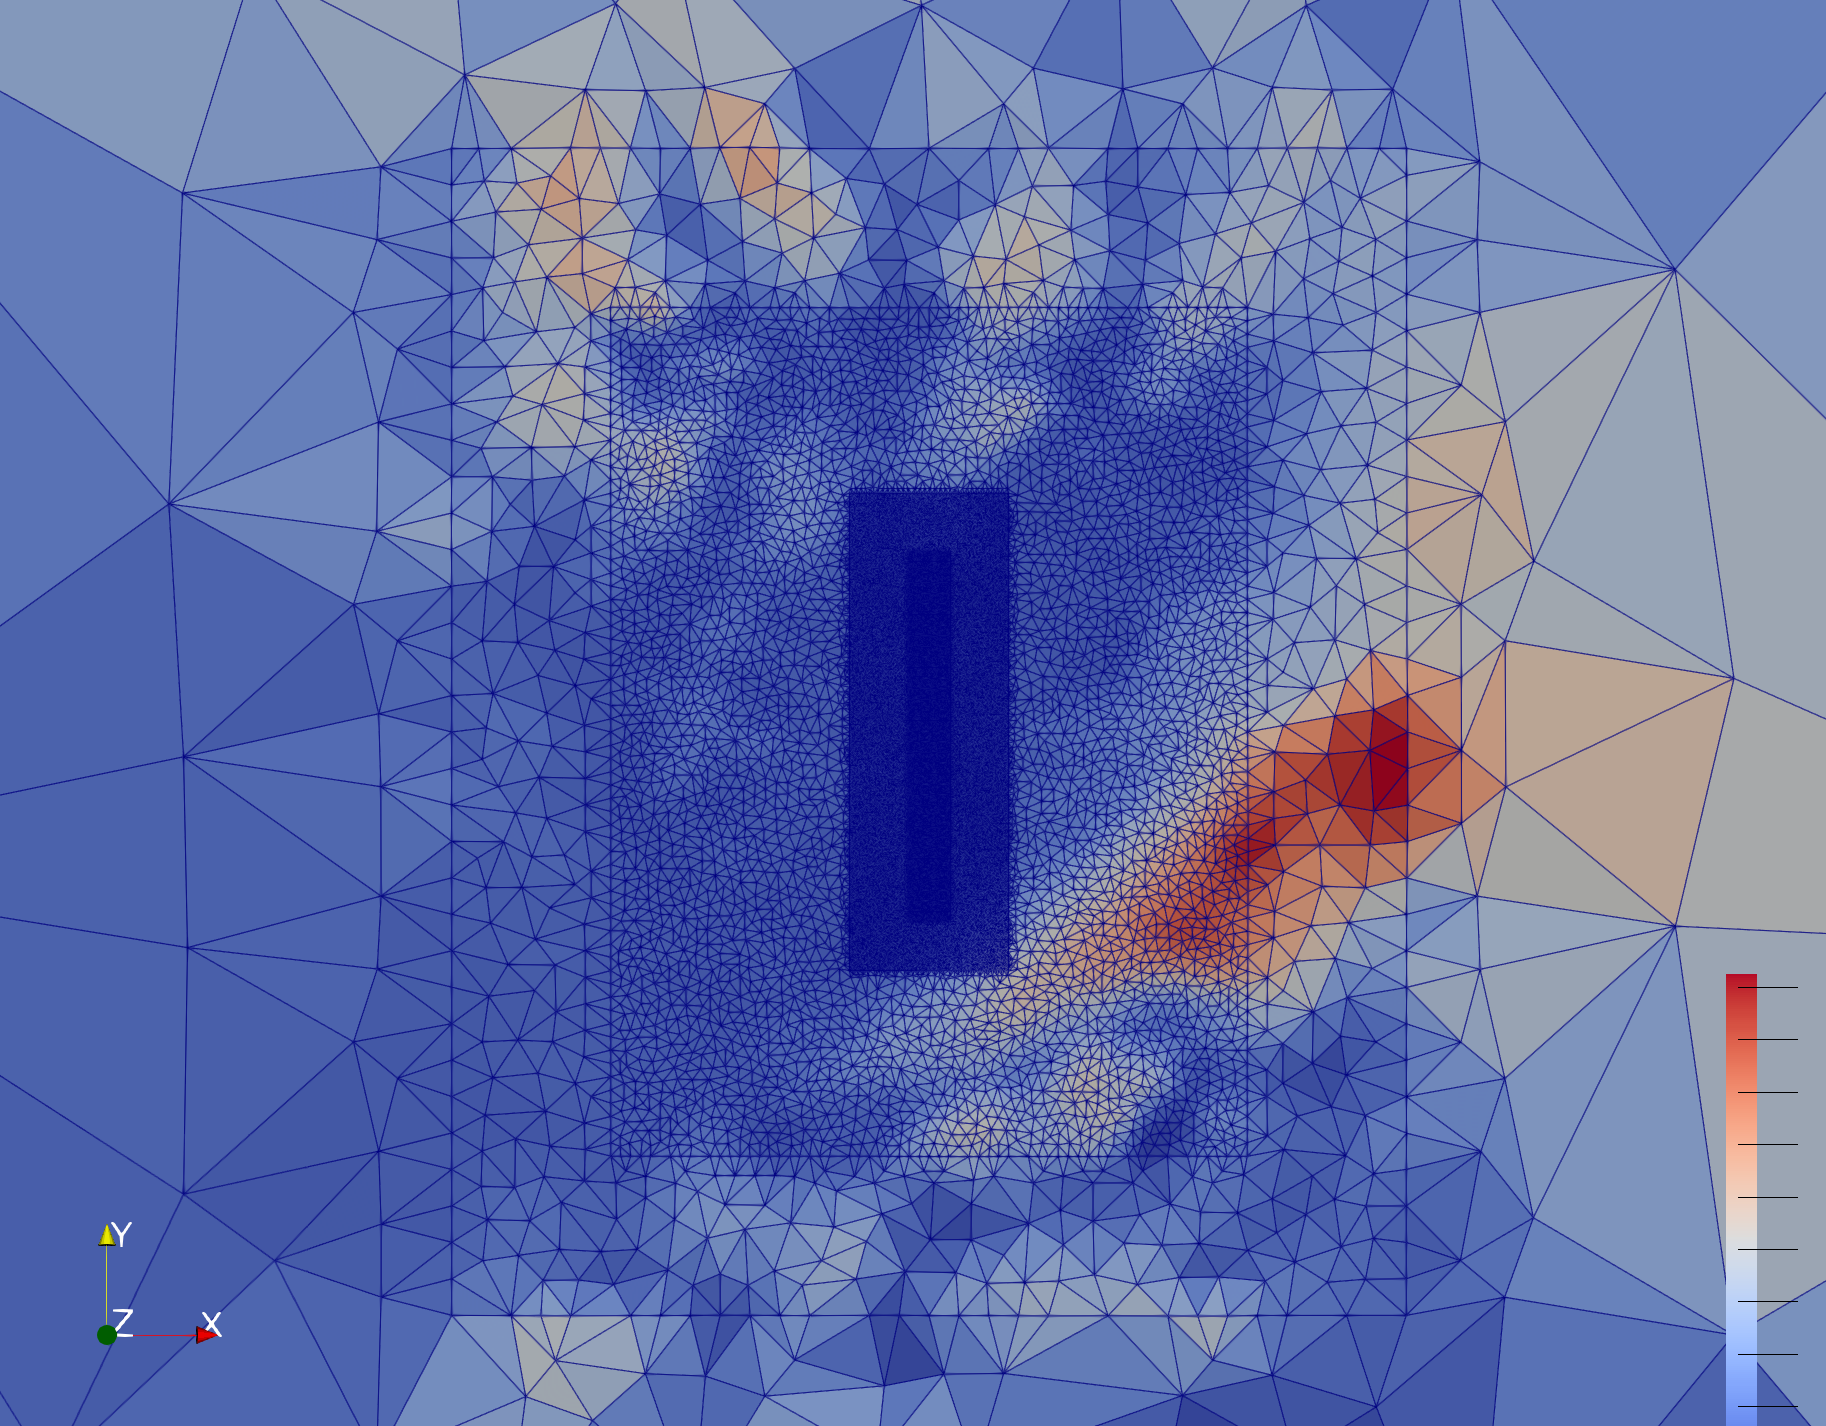
How can I show the edges of the unstructured mesh and set its colors?

Here is the mesh file:

surface_mesh_with_topo.vtu.zip

marcomusy commented 3 years ago

You can use:

pip install -U git+https://github.com/marcomusy/vedo.git

then:

from vedo import *

ug = UGrid('data/surface_mesh_with_topo.vtu')
print(ug.getArrayNames())

# scale makes the z more visible
msh = ug.tomesh().scale([1,1,10]).lineWidth(0.1)

msh.cmap("jet", 'names001', on="cells").addScalarBar(c='w')

show(msh, axes=dict(digits=3), zoom=50)

Screenshot from 2021-04-28 10-30-26

(you can pan the image by dragging with middle mouse button)

XushanLu commented 3 years ago

Thanks very much for your help, @marcomusy. That is awesome. Now I can show the edges without any problems.

XushanLu commented 3 years ago

Hi @marcomusy ,

I've managed to show the edges but I am not sure how to show all nodes in a vtu file. Here is the code that I use to try to plot the edges and nodes at the same time but only edges are shown:

from vedo import UGrid, show, screenshot

surf_file = 'surface_mesh_with_topo.vtu'
ug = UGrid(surf_file)

msh = ug.tomesh().lineWidth(2).lineColor('w')
bounds = [504827, 505227, 6416234, 6416634, 400, 600]
msh.crop(bounds=bounds)
sargs = dict(
    color='k',
    title='Elevation (m)',
    titleFontSize=12,
    horizontal=True,
    pos=(0.2, 0.01),
)
msh.cmap("coolwarm", 'Z', on='cells')
msh.addScalarBar(
    c='k',
    title='Elevation (m)',
    titleFontSize=40,
    pos=(0.75, 0.25),
    size=(50, 800)
)

# font = 'Calco'
# font = 'Comae'
font = 'Kanopus'
axes_opt = dict(
    xtitle='Easting (m)',
    ytitle='Northing (m)',
    ztitle='',
    xTitleColor='k',
    yTitleColor='k',
    xLabelColor='k',
    yLabelColor='k',
    xLabelSize=0.015,
    xTitlePosition=0.65,
    yTitlePosition=0.65,
    xLineColor='k',
    axesLineWidth=2,
    labelFont=font,
    titleFont=font,
)

# Add the tetrahedra for the observation points
tr_list = ['013', '014', '015', '016', '017']
ele_list = ['0116311', '0116349', '0116134', '0116171', '0267813', '0267886',
            '0282449', '0282517', '0253337', '0253404']
ele_vtu = []
iele = 0
for itr in tr_list:
    filename = 'element_iTr=' + itr + '_iObs=0001_idxEle=' + ele_list[iele] + \
        '.vtu'
    ele_vtu.append(UGrid(filename))
    iele += 1
    filename = 'element_iTr=' + itr + '_iObs=0001_idxEle=' + ele_list[iele] + \
        '.vtu'
    ele_vtu.append(UGrid(filename))
    iele += 1

# Add the nodes of the source refinements
node_vtu = UGrid('src_node_with_topo.vtu').tomesh()
# points = node_vtu.insidePoints()
node_crop = node_vtu.crop(bounds=bounds).c('r')

size = [2560, 1600]
show(msh, ele_vtu, node_crop, axes=axes_opt, size=size)
screenshot('src_obs_refinement_vedo.png')

And here is what I got (as you can see, no points are plotted and I would like to plot them as spheres and be able to control the point sizes) image

Here is the zip file contains all the necessary data files: Archive.zip

I guess I can convert the mesh to points and try to plot points instead of meshes but I do not know how to crop the points there, and it would be more straightforward if I can just plot things with the UGrid object.

Thanks in advance for your help!

marcomusy commented 3 years ago

If I understand you want to visualize the vertices of the colored mesh? If so try:

from vedo import UGrid, Spheres, show, screenshot, settings

settings.defaultFont = 'Kanopus'
settings.useParallelProjection = True # avoid perspective parallax
path = 'data/chddem'

ug = UGrid(f'{path}/surface_mesh_with_topo.vtu')

msh = ug.tomesh().lineWidth(2).lineColor('w')
bounds = [504827, 505227, 6416234, 6416634, 400, 600]
msh.crop(bounds=bounds)

msh.cmap("coolwarm", 'Z', on='cells').lighting('off')
msh.addScalarBar(
    title='Elevation (m)',
    titleFontSize=40,
    pos=(0.75, 0.25),
    size=(50, 800),
)

axes_opt = dict(
    xtitle='Easting (m)',
    ytitle='Northing (m)',
    ztitle='',
    xLabelSize=0.015,
    xTitlePosition=0.65,
    yTitlePosition=0.65,
    axesLineWidth=4,
    xrange=msh.xbounds(),
    yrange=msh.ybounds(),
)

# Add the tetrahedra for the observation points
tr_list = ['013', '014', '015', '016', '017']
ele_list = ['0116311', '0116349', '0116134', '0116171', '0267813', '0267886',
            '0282449', '0282517', '0253337', '0253404']
ele_vtu = []
iele = 0
for itr in tr_list:
    filename = f'{path}/element_iTr={itr}_iObs=0001_idxEle={ele_list[iele]}.vtu'
    ele_vtu.append(UGrid(filename))
    iele += 1
    filename = f'{path}/element_iTr={itr}_iObs=0001_idxEle={ele_list[iele]}.vtu'
    ele_vtu.append(UGrid(filename))
    iele += 1

# Add the nodes of the source refinements
node_vtu = UGrid(f'{path}/src_node_with_topo.vtu').tomesh()
node_crop = node_vtu.crop(bounds=bounds).c('r')

nodes = Spheres(msh.points(), r=1).c('k')

size = [2560, 1600]
show(msh, nodes, ele_vtu, node_crop, axes=axes_opt, size=size, zoom=1.2)
# screenshot('src_obs_refinement_vedo.png')

Screenshot from 2021-04-28 17-52-20

PS: your code looks REALLY good :) you're already mastering vedo :) I made a few changes that you might like..

marcomusy commented 3 years ago

..you may also like this instead of addScalarBar:

msh.addScalarBar3D(
    title='Elevation (m)',
    titleSize=1,
    titleXOffset=2,
)
XushanLu commented 3 years ago

Wow, that is great! I like the 3D scalar bar. The ability to have the labels of the axes rotate with the mesh (being 3D) is awesome. However, I'd still like to ask two more questions:

  1. How can I get the camera parameters once I rotate the view under the interactive mode? For example, the following picture is actually what I wanted for the final plot image I need to rotate the view in order to get what I want exactly. But if I need to change any parameters and rerun the script, then I need to rotate it again. I know I can set the camera position when calling show. But how can I know it in the first place?

  2. I like all the axes labels that vedo can do! I can have control over the fontsize, etc, and it rotates with the view, which is awesome! I could not achieve this with PyVista (the reason why I am looking into vedo) because whatever I set as the fontsize, it will not be reflected in the final plot. I previously was using Paraview, and it was a mess when it comes to this issue. It is nothing even remotely close to being smart. However, as can be seen in the above picture, the text is still not super sharp and it is a bit blurry on the edges of the text. While being absolutely better than the other plotting tools I have tried, could it be made of publication quality?

Thanks a lot for your help!

marcomusy commented 3 years ago

How can I get the camera parameters once I rotate the view under the interactive mode?

Just press shift-C on the screen when you are happy with the view and it will print out a camera script that you can paste directly in your code.

The text looks blurry because you lack antialiasing (the actual text is polygonal, so it won't be blurry at any scale!). What is your OS? Are you sure you did: pip install -U git+https://github.com/marcomusy/vedo.git

What happens if you press shift-A in the scene (that should toggle antialiasing). Otherwise you can set directly settings.multiSamples = 8

You can also use pyvista with vedo axes, something like:

# ...
ax = vedo.Axes(mesh)
pyvista.add_actor(ax)

Thanks for the feedback

PS, ah, for the camera, you can also use show(..., elevation=-45)

XushanLu commented 3 years ago

Sorry, I am pretty sure I did not use the code in Github. Now I do, and the issue is fixed. That elevation parameter is really convenient!

I can confirm that Shift-C and Shift-A do what you described. Now I am happy about this picture. I should be trying to reproduce something other pictures that I used to plot with Paraview just for fun. Thanks!

XushanLu commented 3 years ago

Oh, maybe one more question: How do I set the background color of the plot? Or, is there a way to trim the boundary white spaces after saving the screenshot? In PyVista, I would set the background using 'w' color and then I can use the following code to get rid of the white space of the screenshot

from wand import image

with image.Image(filename='src_obs_refinement_vedo.png') as imag:
    imag.trim(color=None, fuzz=0)
    imag.save(filename='src_obs_refinement_vedo_trim.png')

However, both GIMP and wand seem to be unable to trim the extra whitespace near the boundary for the screenshot taken using vedo. Any ideas?

src_obs_refinement_vedo_trim

marcomusy commented 3 years ago

vedo can crop and visualize images, add at the end of the script:

from vedo import Picture
# ...
show(msh, nodes, ele_vtu, node_crop, axes=axes_opt,
     size=size, zoom=1.2, elevation=-45)

npimg = screenshot(returnNumpy=True)
pic = Picture(npimg)
pic.crop(left=0.15, right=0.1, top=0.1, bottom=0.1).write("a.png")
show(pic, axes=1, new=True, bg='black')
Screenshot 2021-04-28 at 21 53 08

To change background color use: show()..., bg="pink", bg2="yellow") # bg2 defines a gradient color Pressing 5and 6also does. Press hto see tthe full list of options.

XushanLu commented 3 years ago

Thanks for pointing out the Picture class, and also the magic 'h' button. That was totally hidden to me.

Using Picture works and I am able to crop the picture to what I want. However, I still think an automatic process would be great if possible. I think the algorithms used in wand just picks up the color at one of the corners and then crops anything that has the same color in the picture from the boundary to inside.

I have set both bg and bg2 to 'w', and I still cannot use wand to crop the picture, which is different from the pictures saved using Paraview and PyVista. With these two, as long as I set the background to 'w', both GIMP and wand works.

I am happy even just using Picture, though.

marcomusy commented 3 years ago

uhm.. maybe if you add at the beginning: settings.rendererFrameWidth = 0 then it might work? What is your operative system?

XushanLu commented 3 years ago

Sorry, I forgot to mention it. My OS is Mac OS Big Sur. When you say it might work, what are you referring to? Is it the wand thing?

Adding settings.rederFrameWidth = 0 did not work for the wand solution. What does that do?

marcomusy commented 3 years ago

Mac OS Big Sur version 11.3 ? (i'm asking for other reasons)

What it does is to remove a thin border which is drawn to separate multiple subwindows in the same rendering window (when they exist). If that doesn't work I'll try to investigate why wand is unable to do the job.

XushanLu commented 3 years ago

11.2.3. I am about to update the OS but have not done that.

I think from what I saw, that did not solve the problem for wand.

marcomusy commented 3 years ago

well.. this is strange... your wand code above works perfectly fine on my mac! it trims the image correctly..

XushanLu commented 3 years ago

Does that mean I need to upgrade my OS??!!

marcomusy commented 3 years ago

I have no idea, ..but I doubt it!