marcomusy / vedo

A python module for scientific analysis of 3D data based on VTK and Numpy
https://vedo.embl.es
MIT License
2.04k stars 265 forks source link

Overlay a network over voronoi testellation #478

Closed DeepaMahm closed 2 years ago

DeepaMahm commented 3 years ago

Hi @marcomusy,

I would like to create a geometry like the following in vedo.

source image

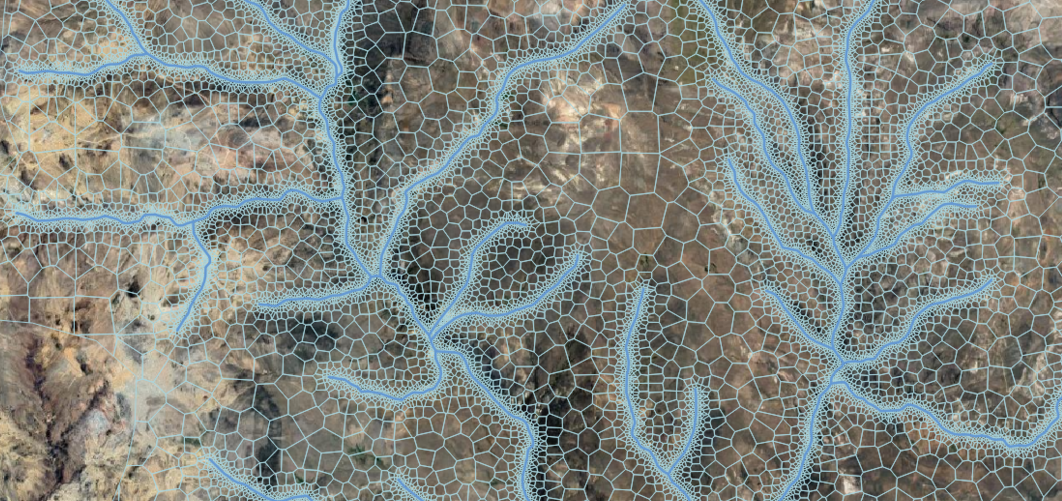
For this, I would like to use vedo

  1. create a network like this https://github.com/marcomusy/vedo/issues/341
  2. overlay a Voronoi tessellation on the network in step 1. https://github.com/marcomusy/vedo/issues/475
  3. find the index of the Voronoi cells through which the network edge traverses

I am not sure how to do step 3. Could you please give some ideas and help me with this?

Thanks a lot for all your support

marcomusy commented 3 years ago

Hi Deepa, the example on the web deosn't work me, anyway, try

#!/usr/bin/env python3
#
import geopandas as gpd, numpy as np
from scipy.spatial import Voronoi
from vedo import Points, Grid, delaunay2D, Mesh, show

shape = gpd.read_file('shps/rios.shp')

def vertexAsList(shape):
    vertexList = []
    for line in shape.iterrows():
        partialList = []
        if line[1].geometry.geom_type == 'Polygon':
            pointList = line[1].geometry.exterior.coords.xy
        elif line[1].geometry.geom_type == 'LineString':
            pointObject = line[1].geometry.coords.xy
            pointList = list(zip(pointObject[0],pointObject[1]))
            for index, point in enumerate(pointList):
                partialList.append(point)
        vertexList += partialList
    return np.array(vertexList)-[610000,8300000]

pts = Points(vertexAsList(shape))#.densify(.01)

grid = Grid([14500, 61700, 0], sx=24000, sy=26000, resx=30, resy=30).ps(1)
allpts = pts.points().tolist() + grid.points().tolist()
allpts = np.array(allpts)

deln = delaunay2D(allpts).lw(0.1)
#deln.smooth()

#vor = voronoi(allpts[:,(0,1)]) ## VTK IS TOO SLOW ON THIS!
vor = Voronoi(deln.points()[:,(0,1)])

regs = [] # filter out invalid indices
for r in vor.regions:
    flag=True
    for x in r:
        if x<0: flag=False
    if flag and len(r):
        regs.append(r)

msh = Mesh([vor.vertices, regs])
msh.lw(0.1).cmap('Set3', list(range(len(regs))), on='cells')

show([deln, [msh,Points(deln)]], N=2, axes=dict(digits=3))

Screenshot from 2021-10-09 20-33-40

DeepaMahm commented 3 years ago

@marcomusy, I am a little bit confused with this line

grid = Grid([14500, 61700, 0], sx=24000, sy=26000, resx=30, resy=30).ps(1) I understand sx and sy are the size of x and y axes. Does size mean x and y limits? Or is this [14500, 61700, 0] the limits?

Could you please clarify?

marcomusy commented 3 years ago

https://vedo.embl.es/autodocs/content/vedo/shapes.html?highlight=grid#vedo.shapes.Grid

DeepaMahm commented 3 years ago

@marcomusy,

Thank you. What is still not clear to me is the following: sy = 26000 which I understand is the total size of the y axis. In the plot I see y positions above 7.00 E+4. So I am not sure why the y values exceeds sy. I am sorry if I am missing something that's obvious. Could you please explain this?

Also could you please clarify if [14500, 61700, 0] corresponds to the position (/position of which attribute)?

marcomusy commented 3 years ago

pos indicates the position of the center of the Grid, so 61700+26000÷2=74700 seems correct to me.

from vedo import Grid
Grid().show(axes=8)
DeepaMahm commented 3 years ago

Ahh, thanks a ton! this clarifies my doubts.

DeepaMahm commented 3 years ago

Hi @marcomusy ,

I have an example in which a network is overlayed on voronoi cells image


import matplotlib.pyplot as mplt
import networkx as nx
from vedo import loadStructuredPoints, geometry,\
    show, settings, Points, voronoi, Lines, Plotter
settings.interpolateScalarsBeforeMapping = False
from collections import OrderedDict

G = nx.OrderedGraph()
edges = [(0, 7), (0, 3), (1, 2), (1, 3), (2, 6), (3, 6), (4, 5), (4, 6), (5, 7)]
G.add_edges_from(edges)

pos = OrderedDict()
pos = {0:[64, 10], 1:[81, 78], 2:[17, 88], 3:[23, 33], 4:[40, 18], 5:[100, 63],  6:[12, 55], 7:[59, 50]}
nx.set_node_attributes(G, pos, 'pos')
nx.draw(G, with_labels=True)
mplt.show()
pts = [pos[pt] for pt in sorted(pos)]
lines = [(pos[t], pos[h]) for t, h in G.edges()]
edg = Lines(lines)

pts = Points(pts, c='k', alpha=0.5)
label = [str(node) for node in sorted(G.nodes)]
labs = pts.labels(label, font='VictorMono', c='k').addPos(0.05, 0, 0.5)
plt = Plotter(N=1, size=(100, 100))
strpts = loadStructuredPoints("plot1_000001.vtk")
msh = geometry(strpts).lw(0.1)
msh.print()

cids = msh.pointdata["cell.id"].astype(int)
uids = np.unique(cids)
coords = msh.points()
means = []
for u in uids:
    m = np.mean(coords[cids==u], axis=0)
    means.append(m)
cellpts = Points(means)

vor = voronoi(means, method='vtk').c('k').z(1).lw(0.1).wireframe()
show(pts, edg, labs, msh.lw(0), cellpts, vor, axes=1)

I would like to find the ids/index of voronoi cells through which the edge (1,2) and (1,3) passes. I am not sure what's the best way to do this. I would like to try the following:

  1. find the coordinates of all points that form the line connecting edge (1,2)
  2. find the coordinates of all points that lie within each voronoi cell ( how to get this information in vedo?)
  3. map coordinates that lie on edge e.g. (1,2) to voronoi cell id through which the edge passes

I would like to know if this looks ok or if is there a better way to do this.

Many thanks

marcomusy commented 3 years ago

This is less easy :)

Ideas you can explore:

Good luck!

Screenshot from 2021-10-17 19-56-05 Screenshot from 2021-10-17 19-58-19

marcomusy commented 3 years ago

..oh, an idea could be that you make a Line(p1,p2, res=100) with a resolution , then for each of the 100 points you query the closest point of the voronoi centers with .closestPoint(returnPointId=True) and then retrieve the cell id from that.

DeepaMahm commented 3 years ago

Hi,

Thanks so much. Instead of .closestPoint(returnPointId=True) I tried returnCellId=True and the idea suggested by you works great :)

p1 = pos[1]
p2 = pos[2]
edg12 = Line(p1, p2, res=100)
edg12_pts = edg12.points()
for pt in edg12_pts:
    print('closestPoint', vor.closestPoint(pt, returnCellId=True))