marianoguerra / future-of-coding-weekly

repository to work on future of coding weekly newsletter
https://tinyletter.com/marianoguerra/
32 stars 3 forks source link

Future of Coding Weekly 2022/04 Week 2 #127

Closed marianoguerra closed 2 years ago

marianoguerra commented 2 years ago

✍ Drawing Languages 🖱 Analyzing Visual Programming 📊 Datalog Data Science λ Drawing Lambdas

Our Work

🎥 Geometric programming language update #3 - "meh" to pictogrammatic programming? via Hamish Todd

🧵 conversation

Thumbnail

Hey folks 😁 here's an update on my geometric algebra programming environment project

marianoguerra commented 2 years ago

🎙 Hest Podcast: comparing and contrasting Crosscut and Hest via Ivan Reese

🧵 conversation

Last week, Ink & Switch published the Crosscut essay, which describes our (@Szymon Kaliski, Marcel Goethals, and my) work on a prototype tool for drawing dynamic models of your thoughts. It's a fount of FoC-relevant ideas. For instance, combining the place where the programming happens with the place where the program runs, but even further using the same tools for building and working inside the program. Also, Crosscut tries to not feel like programming, and present a minimalist interface that is ruthlessly focused on emulating the best aspects of traditional pen & paper. If you haven't taken the time to read the essay, you're.. probably busy, I shouldn't bother you, sorry. I'll just leave a note on the door.

Before working on Crosscut, I had been slowly chipping away at my own FoC project called Hest (yeah, still just that one blog post). I also made a podcast just to think out loud about the project, so that I could self-reflect and thus hone my ideas and goals, and maybe someday build another prototype. But when the Crosscut project started, it drew all my attention, and the podcast stopped.

Today, with Crosscut done and released to the world, I'm here to share a new Hest podcast episode — 46 minutes long — in which I compare and contrast Crosscut and Hest.

To find out, kindly use this hand-crafted RSS feed, search for Hest or Ivan Reese in your podcast player of choice, or click one of the buttons here: pod.link/1559446316

And stay tuned for more episodes. They won't be on a schedule, but they will be about as relevant and entertaining as this fine slack message. So, fifty-fifty, eh? ;)

marianoguerra commented 2 years ago

📝 The Causes of Latency in Computing Systems, and Why Exactly It Frustrates Us via Nick Arner

🧵 conversation

Wrote a post on Latency in Computer Systems - what causes it, and why it frustrates us

marianoguerra commented 2 years ago

🎥 Lisperanto - in browser IDE via Oleksandr Kryvonos

🧵 conversation

Thumbnail

made an intro video about my Lisperanto project

marianoguerra commented 2 years ago

Thinking Together

💬 Eric Gade

🧵 conversation

Anyone here know about in-browser ML tools for building models using images? In this case, we'd like to annotate ("draw" where relevant lines are present) some subset of an image corpus to build a model, and to do so interactively, feeding this training data into some easily configurable NN tool. Is there anything like this that is simple from a UI point of view?

marianoguerra commented 2 years ago

💬 Joakim Ahnfelt-Rønne

🧵 conversation

Inspired by the recent post on Crosscut, I started thinking about geometric programming, and what it might look like.

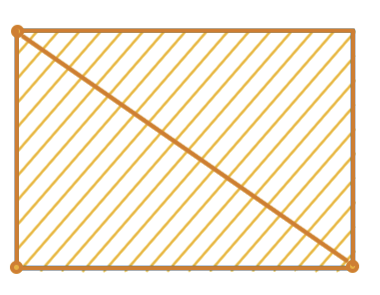
I came up with the idea of using areas and line segments of 2D shapes as inputs and outputs.

For example, a rectangle gives us addition (the half circumference), multiplication (the area), square root (using area as an input and measuring one of the sides):

image.png

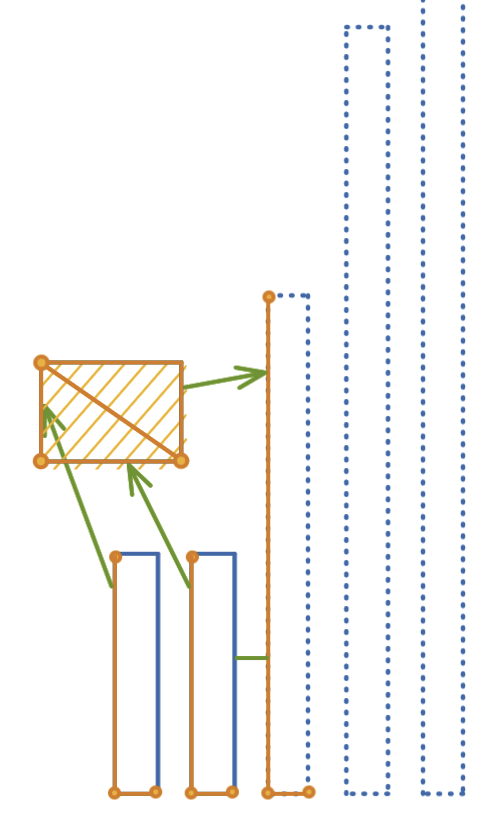
One could imagine an iteration construct ala the one in Bret Victors computational drawing program, or similar to the one in Crosscut, that allowed expressing e.g. Fibonacci iteratively:

image.png

Here the green arrows connect inputs lines to output lines, and the dots show where line segments begin and end.

The dotted rectangles represent iteration, where the first rectangle is used to specify the relation to previous rectangles (exactly how is a bit vague, I know). The green line sets the distance between each iteration.

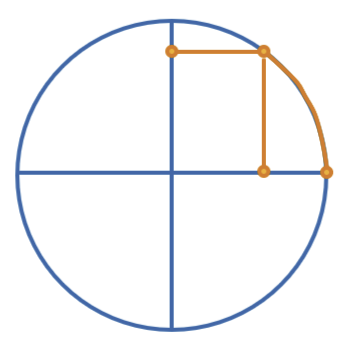
Similarly, a unit circle could show the angle as a bent line (in radians, as the circumference is 2*pi), and sin/cos as shown. Using sin/cos as inputs and measuring the bent line you get asin and acos:

image.png

Thoughts? Maybe it already exists?

marianoguerra commented 2 years ago

📝 some Lisp via Chris Knott

🧵 conversation

People admire Lisp's "elegance" in that it only has a single built-in datastructure - lists (a b c). Clojure, on the other hand is generally admired for being more "practical". One of the main things Clojure introduced is vectors [a b c], and maps {:a b, :c d} as first class syntax. I was reading some Lisp this week and my brain kept grating/complaining because I was seeing what are conceptually hashmaps written as what I was interpreting as a lists of pairs, something which I "know" to be different.

Conversely, I have always thought it was annoying that C++ has three different operators (::, ., ->) that all essentially mean "member of". Would C# be better if you had to say System::Console.Print() instead of System.Console.Print()? No, I think most people would rarely feel the need to conceptually distinguish between these things, the C++ syntax is just annoying noise to me.

What is it that distinguishes Clojure's brilliant decision to expand the syntax, from C# brilliant decision to compress the syntax?

It implies to me that if there is a scale of simplicity-to-expressiveness, then humans just happen to sit at particular point on it. There's no particular "reason" for why these changes were right other than "they'd gone too far that way, go back this way". There's a local maximum somewhere in the middle.

I have been thinking about this simplicity-to-expressiveness scale recently as it irrationally annoys me that on WikiData, "instance of" is "just another relationship" (it's P31 - "citizen of" is P27!).

I think that RDF is far too far towards the "elegance" end of the spectrum and would greatly benefit from a Clojure-style acknowledgement that some things are more different, and should be more differentiated. Yeah, it's mildly interesting that Node-Rel-Node triples is all you need to describe an ontology, but that's not actually how people think about the world...

marianoguerra commented 2 years ago

Reading Together

🔗 Diagramming techniques for analysts and programmers : Martin, James, 1933 via Christopher Shank

🧵 conversation

A book called “Diagramming Techniques for Analysts and Programmers” (1985). Found it through a paper by David Harel. He descibed it as:

The state of the art on diagrammatic languages at the time can be gleaned from the book by Martin and McClure titled > Diagramming Techniques for Analysts and Programmers> . This book discussed many visual techniques, but little attention was given to the need for solid semantics and/or executability. Curiously, this book could have helped convince people that visual languages should not be taken seriously as means to actually program a system the way a standard programming language can.

marianoguerra commented 2 years ago

📝 Usability Analysis of Visual Programming Environments: a ‘cognitive dimensions’ framework via Christopher Shank

🧵 conversation

Also started reading through “Usability Analysis of Visual Programming Environments: a ‘cognitive dimensions’ framework” by Green and Petre (1996).

The dimensions in outline: The list of dimensions that we shall use in this paper follows. For each dimension we supply a thumb-nail description. A lengthier account of the dimension and its relation to the underlying evidence will be found in the appropriate section below.

marianoguerra commented 2 years ago

Content

📝 https://twoville.org/#index via Jack Rusher

🧵 conversation

Code + direct manipulation interface with two-way binding for building diagrams

marianoguerra commented 2 years ago

💻 percival.ink: an interactive in-browser notebook for declarative data analysis and visualization via Mariano Guerra

🧵 conversation

Percival is an interactive in-browser notebook for declarative data analysis and visualization. It combines the power of compiled Datalog queries with the flexibility of modern plotting libraries for the web.

marianoguerra commented 2 years ago

Project Overview ‹ λ-2D: An Exploration of Drawing as Programming Language, Featuring Ideas from Lambda Calculus via Jimmy Miller

🧵 conversation

Draw executable lambda expression diagrams

marianoguerra commented 2 years ago

📝 Visual Programming Languages and the Empirical Evidence For and Against via Christopher Shank

🧵 conversation

"Visual Programming Languages and the Empirical Evidence For and Against" (Whitley, 1996)

The past decade has witnessed the emergence of an active visual programming research community. Yet there has also been a noteworthy shortage of empirical the resulting research. This paper summarizes empirical data relevant to visual programming languages both to show the current empirical status and to act as a call to arms for further empirical work.

marianoguerra commented 2 years ago

https://tinyletter.com/marianoguerra/letters/future-of-coding-weekly-2022-04-week-2