Closed devanshidiaries closed 4 years ago
Thanks for the report.
The original ChartJs radar chart distribution has the type stored as int
I don't think that's true. The data-type is an array of numbers. As already mentioned in #105, all numbers in JavaScript are a 64-bit floating point number. As is a double
. int
is a 32-bit signed integer number. That's not the same thing. While it's easy to represent an integer number as a floating point number, it's hard or even impossible to represent a floating point as an integer number.
What you're seeing is chart.js choosing a step value. You haven't provided any code so I can't modify and test it but try setting StepSize
for the axis. Unfortunately, radar chart is one of the charts that haven't been reworked yet so there are a lot of issues with it. You should still be able to assign a Scale
object to the Scale
property and then a LinearRadialTicks
object to the Ticks
property of that. Because it hasn't been reworked yet, this isn't as straight-forward as it's supposed to be but it's still possible. Then on that LinearRadialTicks
instance, set StepSize
to 1.
Please try it and share your code :)
If it works, great; otherwise I'll look into it again and try to provide the code you need.
Apologies, of course you can't assign LinearRadialTicks
to CartesianTicks
. We really need to get working on the radar-rework. There's a huge amount of work to be done for release 2.0 and I hope we can correct all the errors and focus on new features moving forward.
I'm currently the only active maintainer but I'm not the owner of the project and I'm currently waiting for approval of Marius to implement new features.
Until this is fixed in a new release (which unfortunately might take a while), you can override the Ticks
property in your own class. Something like this (untested):
public class RadarScale : Scale
{
public new LinearRadialTicks Ticks { get; set; }
}
Then use that class instead of Scale
.
This is the best I can do right now. Of course it shouldn't be this way and the Scale
class shouldn't even exist; there's already a LinearRadialAxis
(which probably also needs work).
Also, here is the complete code example for the implementation I am looking for, out of this repo.
I've looked your code and the workaround I mentioned in my previous comment works. Here's the full code:
@using ChartJs.Blazor.ChartJS.Common.Properties
@using ChartJs.Blazor.ChartJS.RadarChart
@using ChartJs.Blazor.Charts
@using ChartJs.Blazor.Util
<h1>Radar Chart</h1>
<div class="row">
<button class="btn btn-primary" @onclick="OnClick">Add Dataset</button>
</div>
<ChartJsRadarChart @ref="_radarChartJs" Config="@_config" Width="600" Height="300" />
@code {
private RadarConfig _config;
private ChartJsRadarChart _radarChartJs;
private Random _rand = new Random();
protected override void OnInitialized()
{
_config = new RadarConfig
{
Options = new RadarOptions
{
Title = new OptionsTitle
{
Display = true,
Text = "Participant's scores"
},
Scale = new RadialScale
{
Ticks = new ChartJs.Blazor.ChartJS.Common.Axes.Ticks.LinearRadialTicks
{
StepSize = 1
}
}
}
};
_config.Data.Labels = new List<string> { "A", "B", "C", "D", "E", "F", "G", "H", "I", "J", "K", "L", "M", "N" };
List<int> fakeData = new List<int> { 2, 5, 1, 3, 1, 1, 4, 2, 3, 4, 2, 2, 2, 3 };
List<double> y = new List<double>();
foreach (var dataPoint in fakeData)
y.Add(dataPoint);
_config.Data.Datasets.Add(new RadarDataset
{
Data = y,
Label = $"Participant {_config.Data.Datasets.Count + 1}",
BorderColor = ColorUtil.RandomColorString()
});
}
public async Task OnClick()
{
List<int> fakeData = new List<int> { 1, 1, 1, 3, 1, 1, 4, 2, 3, 4, 5, 2, 5, 3 };
List<double> y = new List<double>();
foreach (var dataPoint in fakeData)
y.Add(dataPoint);
_config.Data.Datasets.Add(new RadarDataset
{
Data = y,
Label = $"Participant {_config.Data.Datasets.Count + 1}",
BorderColor = ColorUtil.RandomColorString()
});
await _radarChartJs.Update();
}
// Workaround until ChartJs.Blazor fixes the issue
private class RadialScale : Scale
{
public new ChartJs.Blazor.ChartJS.Common.Axes.Ticks.LinearRadialTicks Ticks { get; set; }
}
}
Note that I've changed some names so I could better understand what's going on. Also I removed the call to Convert.ToDouble
since int
converts to double
implicitly, you don't need that method call.
Thanks @Joelius300 . It worked!
The issue from our side is documented in #110.
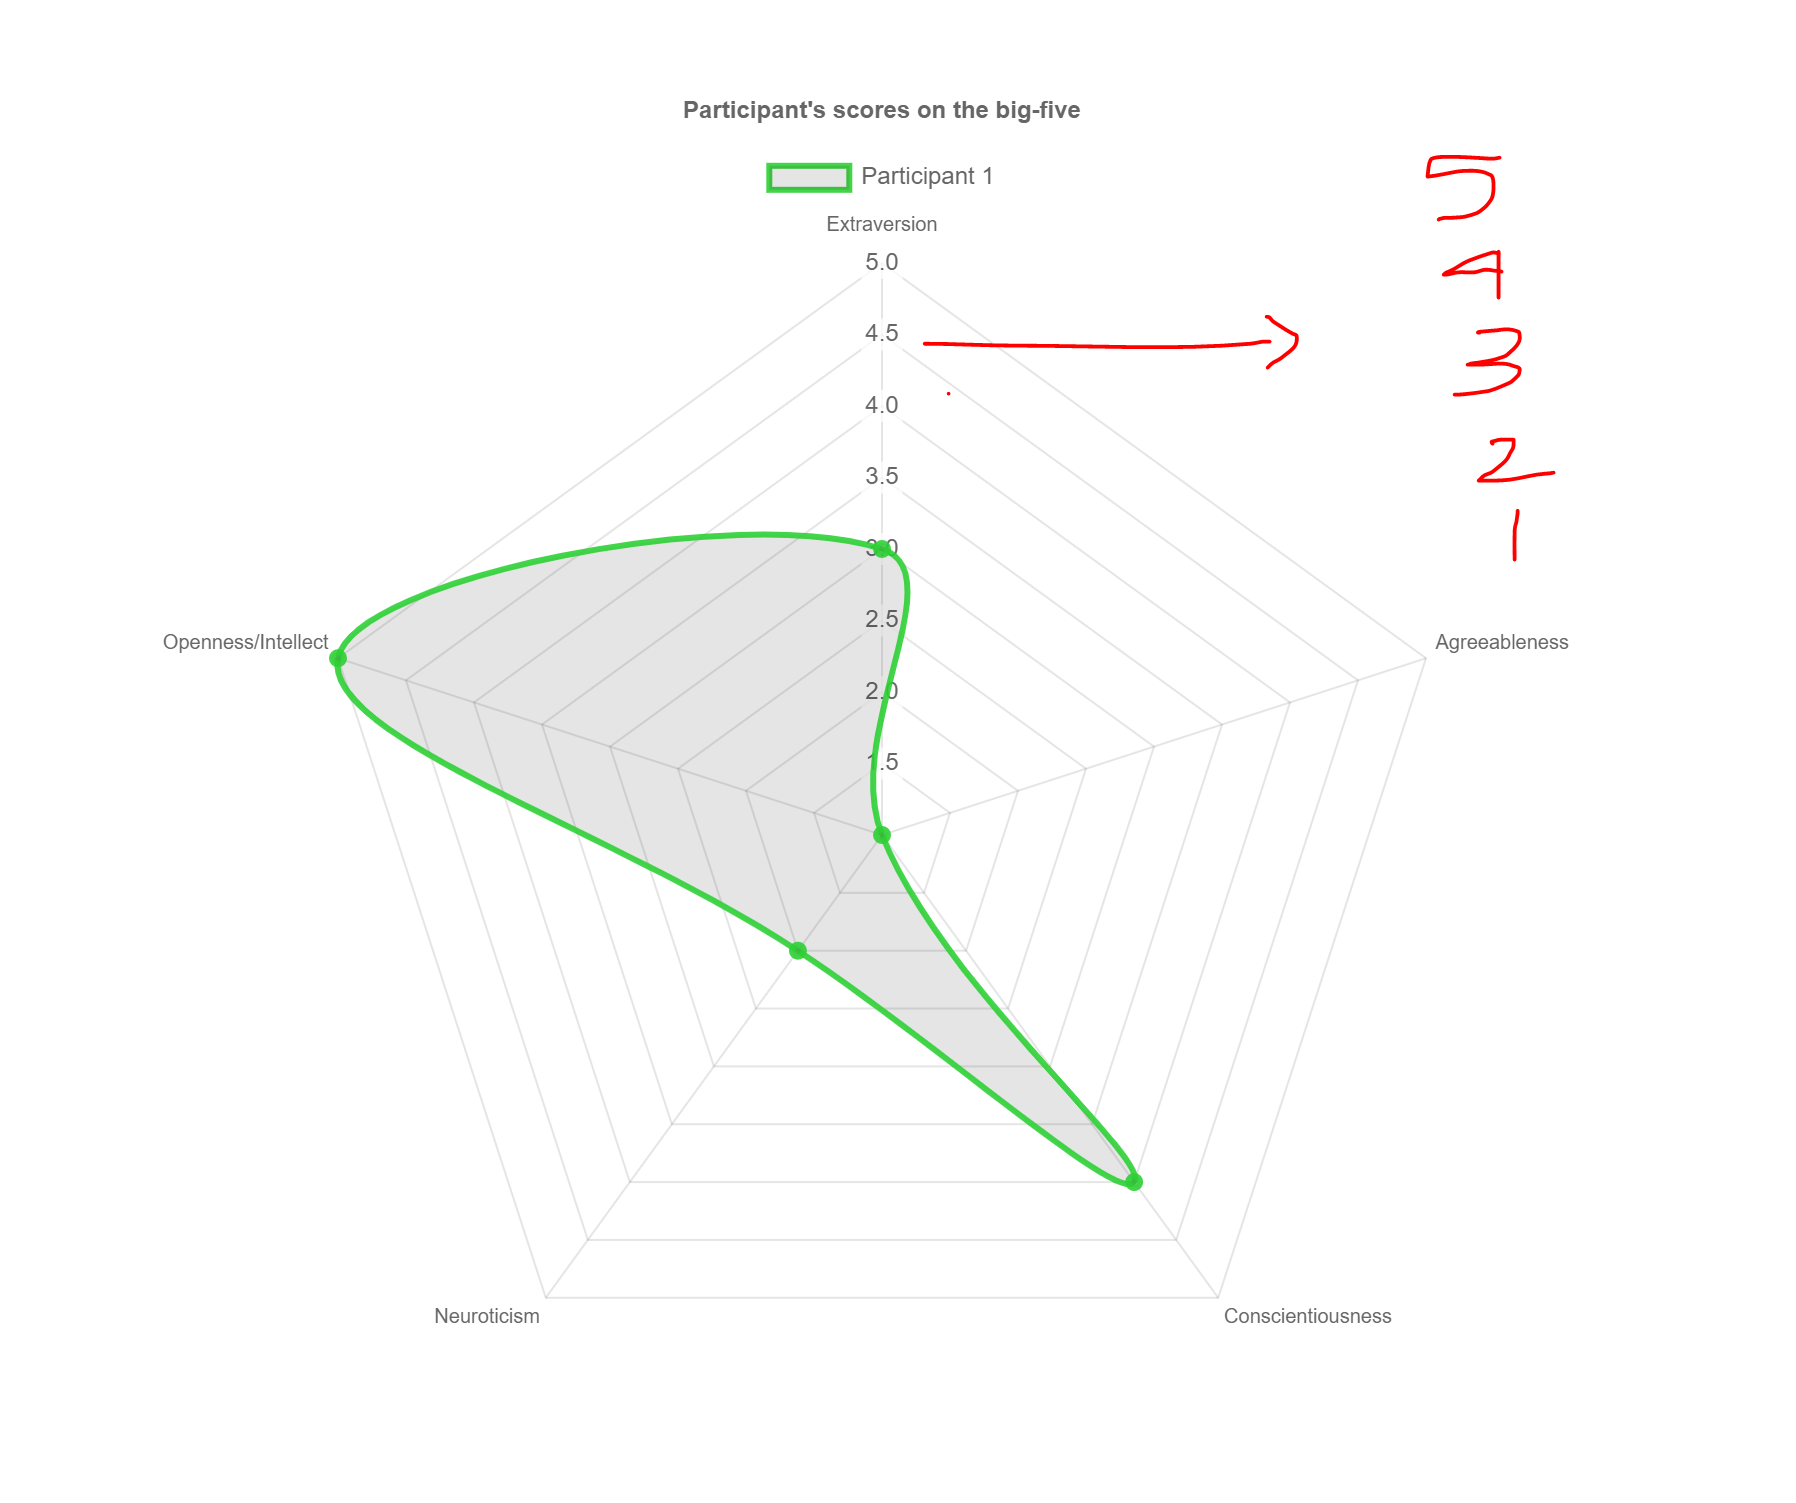
How do I get the int values distribution for ChartJs.Blazor radar chart?
The original ChartJs radar chart distribution has the type stored as int : https://www.chartjs.org/samples/latest/charts/radar.html![image](https://user-images.githubusercontent.com/42736080/81337846-86bcc600-9060-11ea-9a71-d895b730821b.png)
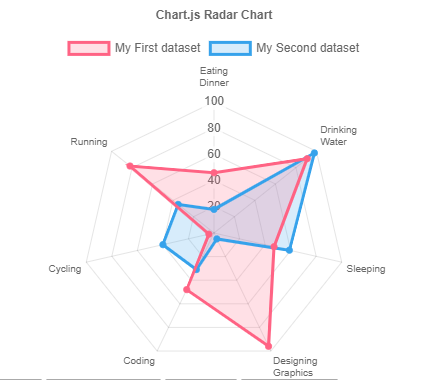
But, when using the ChartJs.Blazor from this repo sample, the radar chart distribution for values between 1 to 5, it is split in fractional parts as highlighted:![MicrosoftTeams-image (5)](https://user-images.githubusercontent.com/42736080/81337711-5117dd00-9060-11ea-99e0-fbecb73d77c1.png)