 Findus23
commented
2 years ago
Findus23
commented
2 years ago Just to be sure? Are you referring to the plots in the Matomo UI or the ones in the E-Mail report? In the former case, this might be a matter of https://github.com/matomo-org/matomo/issues/4969
 bennostaub1
 atom-box
 sgiehl
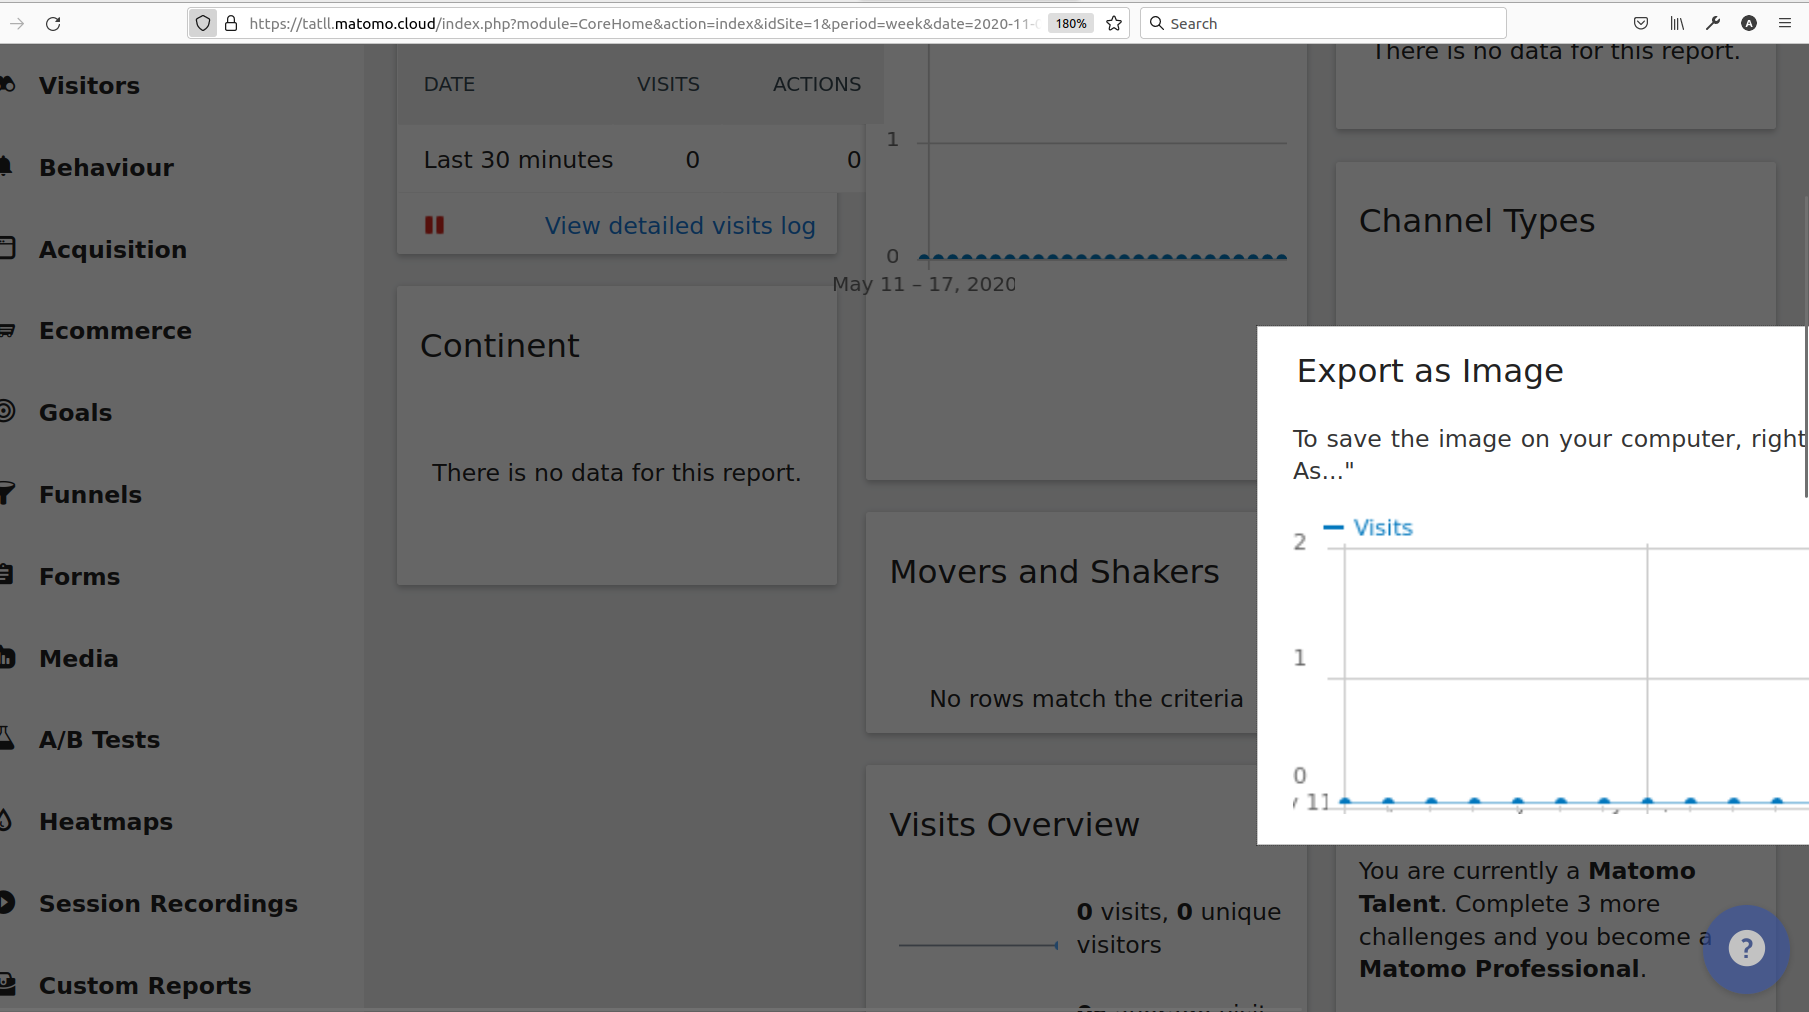
 mJ25-fr
The graphics (this concerns all graphs, pie charts, etc.) should be exportable in a much higher resolution, e.g. as PNG. The current resolution of the graphics is insufficient even for a PowerPoint presentation. The axis labels also need optimization - the subdivisions are often anything but intuitive for both time axes and Y-axes, which makes it difficult to interpret the data and thus communicate the results. Ideally, one should additionally be able to predefine personal color combinations (for the purpose of alignment with a company CI) and preferred aspect ratios (a disproportionately wide graphic often appears in large view).