 DanielGoldfarb
commented
2 years ago
DanielGoldfarb
commented
2 years ago Candle colors are controlled by mplfinance styles, specifically through the marketcolors attribute of an mplfinance style.
There are two approaches to accomplishing what you want. The best is to modify mplfinance.make_addplot() to accept a marketcolors kwarg. This will allow to use different candle colors for each addplot.
The change is fairly easy; about 10 lines of code in src/mplfinance/plotting.py. I've made the changes on my side and they appear to work. However I am also in the midst of a bunch of other stuff so I won't be able to push the changes out for several weeks or more. Therefore I will post the changes here and you can make these changes to your own version of mplfinance:
git diff -wdiff --git a/src/mplfinance/plotting.py b/src/mplfinance/plotting.py
index 21f6945..9eecd52 100644
--- a/src/mplfinance/plotting.py
+++ b/src/mplfinance/plotting.py
@@ -858,7 +858,14 @@ def _addplot_collections(panid,panels,apdict,xdates,config):
if not isinstance(apdata,pd.DataFrame):
raise TypeError('addplot type "'+aptype+'" MUST be accompanied by addplot data of type `pd.DataFrame`')
d,o,h,l,c,v = _check_and_prepare_data(apdata,config)
- collections = _construct_mpf_collections(aptype,d,xdates,o,h,l,c,v,config,config['style'])
+ mc = apdict['marketcolors']
+ if isinstance(mc,dict):
+ apstyle = config['style'].copy()
+ apstyle['marketcolors'] = mc
+ else:
+ apstyle = config['style']
+
+ collections = _construct_mpf_collections(aptype,d,xdates,o,h,l,c,v,config,apstyle)
if not external_axes_mode:
lo = math.log(max(math.fabs(np.nanmin(l)),1e-7),10) - 0.5
@@ -1088,6 +1095,10 @@ def _valid_addplot_kwargs():
'stepwhere' : { 'Default' : 'pre',
'Validator' : lambda value : value in valid_stepwheres },
+
+ 'marketcolors' : { 'Default' : None, # use 'style' for default, instead.
+ 'Validator' : lambda value: isinstance(value,dict) },
+
}
_validate_vkwargs_dict(vkwargs)After you make the above changes, you can then call mplfinance as in the following example:
aapldf  = pd.read_csv('data/yahoofinance-AAPL-20040819-20180120.csv',index_col=0,parse_dates=True).iloc[-61:-1]
googdf = pd.read_csv('data/yahoofinance-GOOG-20040819-20180120.csv',index_col=0,parse_dates=True).iloc[-61:-1]

mcblue  = mpf.make_marketcolors(base_mpf_style='default',up='b',down='b',ohlc='b')
mcgreen = mpf.make_marketcolors(base_mpf_style='default',up='limegreen',down='limegreen',ohlc='limegreen')

sblue = mpf.make_mpf_style(base_mpf_style='default',marketcolors=mcblue)

ap = mpf.make_addplot(googdf,type='candle',marketcolors=mcgreen)
mpf.plot(aapldf,type='candle',style=sblue,returnfig=True,addplot=ap)
The result looks like this:

Notice that ...
Notice that when the prices of the two time-series are different orders of magnitude (as in the above example) then two y-axis scales are used: one on the left and one on the right. Be careful if you have more than two time-series of various orders of magnitue, since a matplotlib plot can only easily have two y-axes of different orders of magnitude. (There are ways to have more than two y-axes, but it is tricky to label them unambiguously).
Notice also that when the candles for a given time-series are all one color, then you cannot tell which candles are up (close higher than open) and which are down. Alternatively you can use `type='ohlc':

If you don't want to make the above change to your own installed version of mplfinance (until we can release the change officially), there is a kludgey workaround you can implement by calling mplfinance twice: once to have it return the Axes objects, and a second time passing the same Axes objects back into mplfinance. I don't recommend doing this, but it does allow you to accomplish the same thing without modifying mplfinance:
aapldf  = pd.read_csv('data/yahoofinance-AAPL-20040819-20180120.csv',index_col=0,parse_dates=True).iloc[-61:-1]
googdf = pd.read_csv('data/yahoofinance-GOOG-20040819-20180120.csv',index_col=0,parse_dates=True).iloc[-61:-1]
datalen = len(googdf)
if datalen != len(aapldf):
    raise ValueError('len(googdf) != len(aapldf)')

mcblue  = mpf.make_marketcolors(base_mpf_style='default',up='b',down='b',ohlc='b')
mcgreen = mpf.make_marketcolors(base_mpf_style='default',up='limegreen',down='limegreen',ohlc='limegreen')

sblue = mpf.make_mpf_style(base_mpf_style='default',marketcolors=mcblue)
sgreen = mpf.make_mpf_style(base_mpf_style='default',marketcolors=mcgreen)

# Create a dummy ohlc dataframe with only a single data point and the rest `nan` values
# (mplfinance will reject a dataframe that is 100% nan values, thus the need for one data point).
# The dummy ohlc df will be used in the
# - first `mpf.plot()` call, for the addplot, in order to create a secondary y axis (`axlist[1]`) below), and in the
# - second `mpf.plot()` as an "empty" df, so as not to overwrite what was plotted in the first `mpf.plot()` call.
df = pd.DataFrame()
df['Open']  = [float('nan')]*datalen
df['High']  = [float('nan')]*datalen
df['Low']   = [float('nan')]*datalen
df['Close'] = [float('nan')]*datalen
df.index = aapldf.index.copy()
# Add one data point to the empty data frame
# using the data that will be plotted by the `addplot` kwarg (i.e. on the secondary axis)
# (notice we are setting O,H,L, and C all to the 'Open' value so that this candle or bar will be barely visible)
df.loc[df.index[0]] = googdf.loc[df.index[0],'Open']

# Now plot the first candle set, creating a secondary y axis (with the dummy df) for the second candle set:
# set `returnfig=True` to get back the Axes list to be used in the second `mpf.plot()` call:
ap = mpf.make_addplot(df,type='candle',secondary_y=True)
fig, axlist = mpf.plot(aapldf,type='candle',style=sblue,returnfig=True,addplot=ap)

# Now change the single point to the value that was used for the first set of candles
# so that it matches the order of magnitude of the primary axis:
df.loc[df.index[0]] = aapldf.loc[df.index[0],'Open']

# Now plot the secondary axis data, with it's own style
# while the primary axis gets the dummy dataframe:
ap = mpf.make_addplot(googdf,type='candle',ax=axlist[1],secondary_y=True)
mpf.plot(df,type='candle',ax=axlist[0],style=sgreen,addplot=ap)

# Now display or save the plot:
if display_the_plot:
    mpf.show()
elif save_the_plot:
    fig.savefig('plotname.png')
PT-BalazsBorbola
We're trying to make a chart with multiple, overlapping candlesticks. The code we're using is this:
Using this code, the end result looks like this: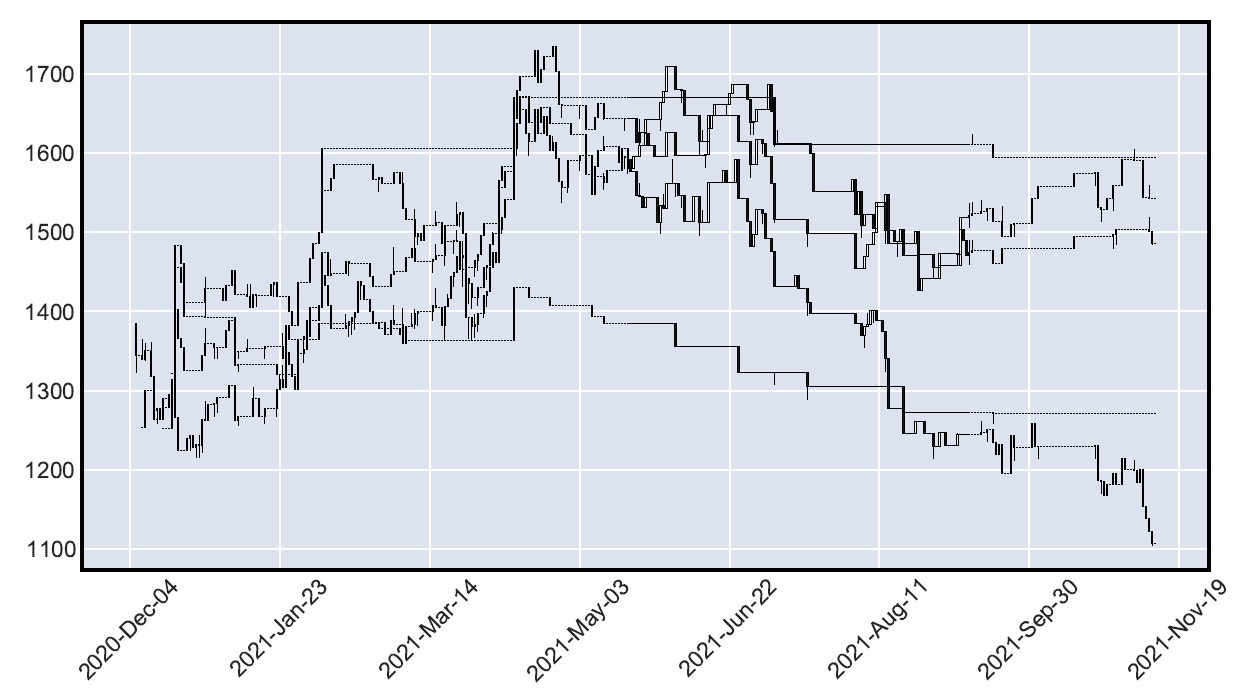
Quite ugly, I know. It will get tidied up and with better resolution it will work out well enough. What we need however, is to color every candlestick data series a SINGLE color (unlike other candlesticks; basically one series red, another one blue, and so on), not unlike a multiline chart.
However, you can't use color= for make_addplot() if type is "candle", and if you apply a style at plot(), it will apply to ALL candlesticks. How could you color each and every candlestick a different color?