 DanielGoldfarb
commented
1 year ago
DanielGoldfarb
commented
1 year ago @The1iAmNeo Very interesting! I will take a closer look in a week or so (busy with another project for the next week or so). At that time I will look into how best to implement this, and where it should fall in priorities. How are your python coding skills? Perhaps you can help with some of the coding? Thanks. All the best. --Daniel
 quantfreedom
 kzaheer09
 andrewrgarcia

 Philip030601
 KMey-create
 Vimal-Seshadri-Raguraman
 jamesdidit72
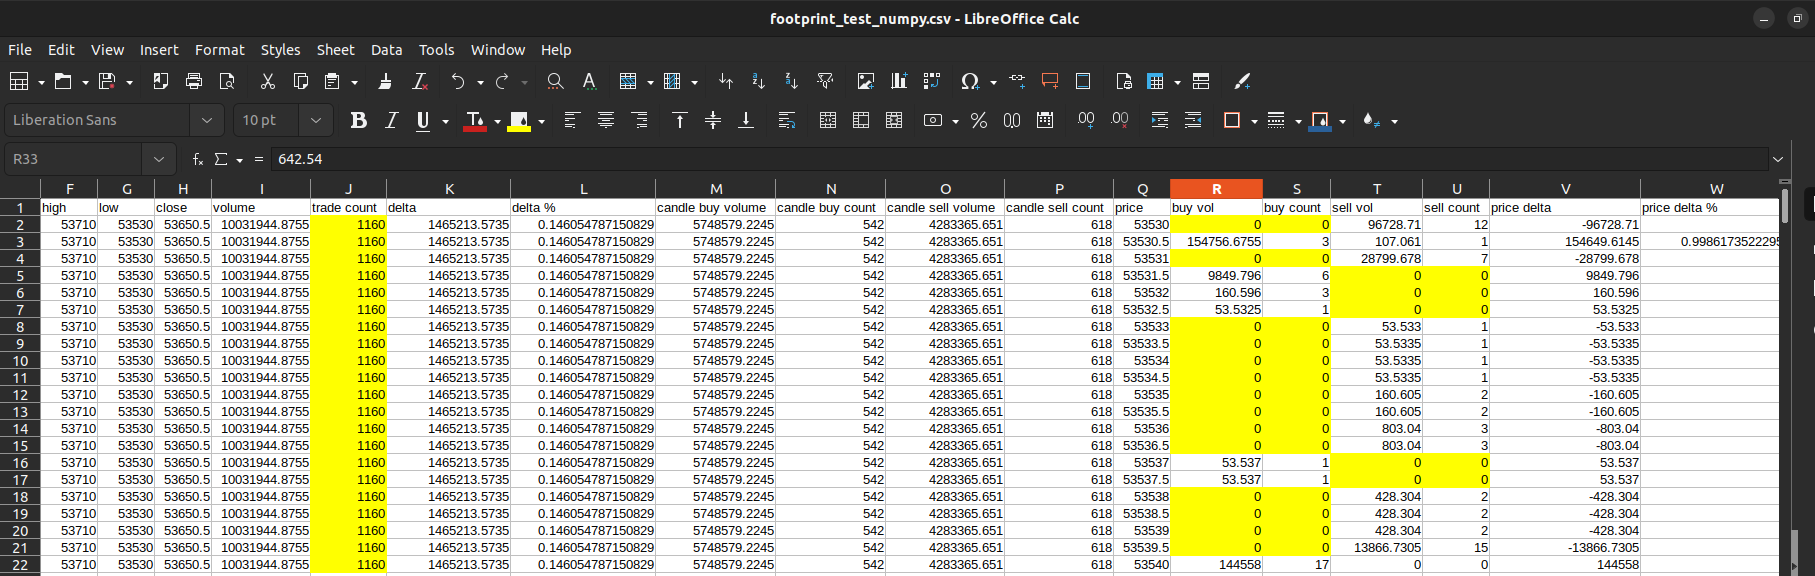
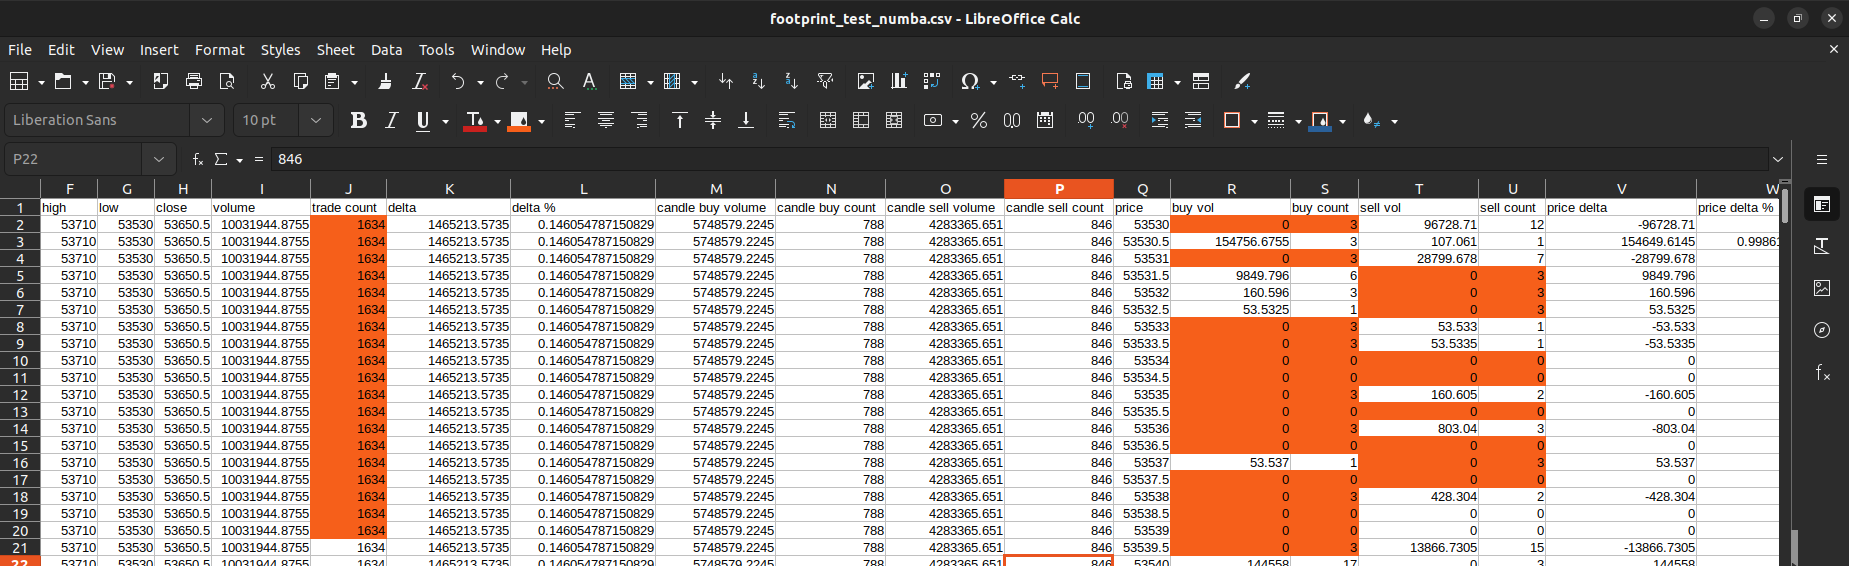
i want to create a footprint chart like this one where i am able to make an open high low close but also show how much trading volume was at each y value of the candle
here is an example of what i am talking about
its very easy to get the data ... getting and understanding how to organize the data on our end is very very easy ... you can see what a csv file would look like here ... https://public.bybit.com/trading/BTCUSD/
lets say i wanted to create a 5 min candle ... for the info i would just add up all the sell orders at each price point of the candle and do the same for the buy orders ... then i have a dataframe within the candle that tells me the sell column and buy column ... and you can get the open high low close even from that data ... the open is the first trade at the start of the candle then the high is the highest point ... low is the lowest point and the close is the last candle ...
this info helps us visualize at what price point in the candle has the most trade volume ... footprint charts are used in high level trading ... I will be making a ton of videos on this subject if we can get one of these open source plotting platforms to help create something like this
all we would need is send dataframes inside a master dataframe ... so you have the overall dataframe that houses all of the candles and inside each candle is a dataframe of all of the sell and buy data at each price of the candle
ultimately would be nice for it to look like this ... but for now the top one would be ultra sexy