 kantic
commented
2 years ago
kantic
commented
2 years ago The problem is that in the documentation of the function top_k_motifs it is stated that the exclusion zone defaults to half of the window size. But later in the mp_top_k_motifs function, the value for exclusion_zone is read from the profile dict (under the key 'ez') generated by the mpx function, which sets this value to zero. This leads to the fact that the exclusion zones are not correctly set during the computation of the top k motifs.
When I manually set the exclusion zone to half of the window size, I get the expected results:
profile = mp.discover.motifs(profile, k=1, exclusion_zone=int(150/2)) Eric-Simon-IA


Describe the bug When I've tried to compute and discover motifs on my time series data, I noticed that the method
mp.discover.motifsalways returns only one motif and the same neighbor multiple times.I've also tried to compute the motifs on the predefined "ecg-heartbeat-av" dataset by following exactly the steps as shown in this example of the documentary. Unfortunately, I encounter the same problem and get results which are different from the example in the documentary.
Also, when I change the parameter
k=3, I get the same motif multiple times. Furthermore, no matter which value I set for the parametermax_neighbor, I always get the same single neighbor that many times.To Reproduce Steps to reproduce the behavior: Just follow the steps mentioned in the example from the documentary:
The motif plot I get looks like: Note that I only get one neighbor, which is returned 10 times (default value of
max_neighbors). If I would change, for example,k=3, I get the same motif three times.Expected behavior The plot from the mentioned example: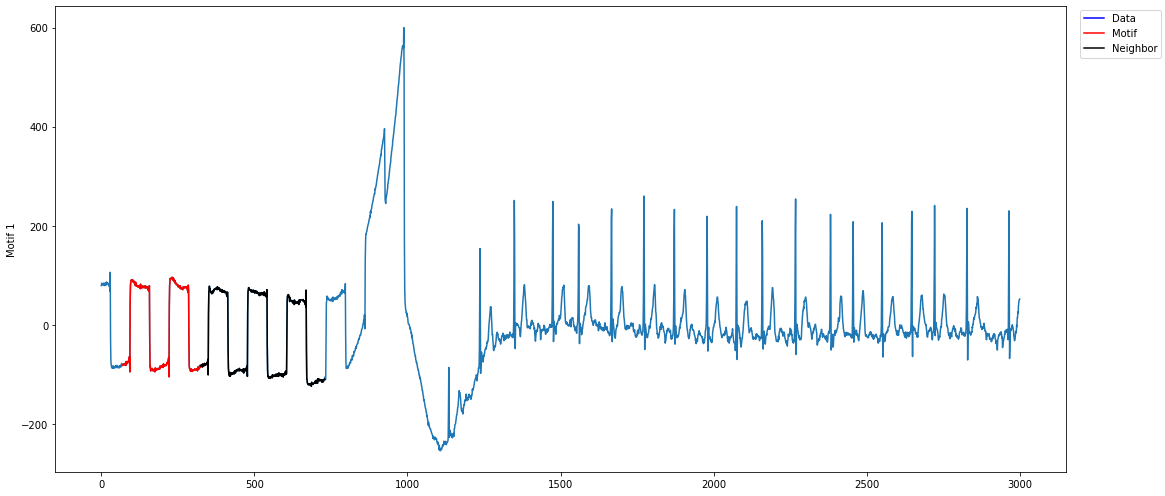 As seen in the plot from the documentary, I would expect to get different neighbors. Also, I would expect that the method returns different motifs when the parameter
kis increased.Screenshots See the plots above.
Desktop (please complete the following information):