Closed ldti closed 4 years ago
This limitation is built into the Grafana timeseries data format (at least, from what I've seen - correct me someone if this is wrong).
I was looking at this the other day, and the only way I know of to create multiple lines on (say) the Graph control, is to declare multiple queries - each one a different CSV file, with each file having just two columns - a date and a value.
Personally, I do almost all my work with table-formatted datasets which don't have this restriction. I would have thought that some of the standard graphite queries etc. would return multiple values, so maybe this restriction that comes with the SimpleJSON data-source. Let me know if you know more about this.
On Wed, Apr 1, 2020 at 4:27 PM ldti notifications@github.com wrote:
Hey. Is is possible to add multiple values per row in time series mode? right now i can see it only parses the first column after date/time.
— You are receiving this because you are subscribed to this thread. Reply to this email directly, view it on GitHub https://github.com/michaeldmoore/CSVServer/issues/8, or unsubscribe https://github.com/notifications/unsubscribe-auth/AA4NLLTJEQQPBR7RGV5NPB3RKNMM5ANCNFSM4LZCEWAQ .
-- "That's not grey - I've just come from San Francisco with some flour in my hair"
I can only give you a sample of another project that seems to be doing something similar: https://github.com/pomber/covid19
And then this converts it to grafana appropriate JSON: https://github.com/twei55/covid19-grafana-datasource
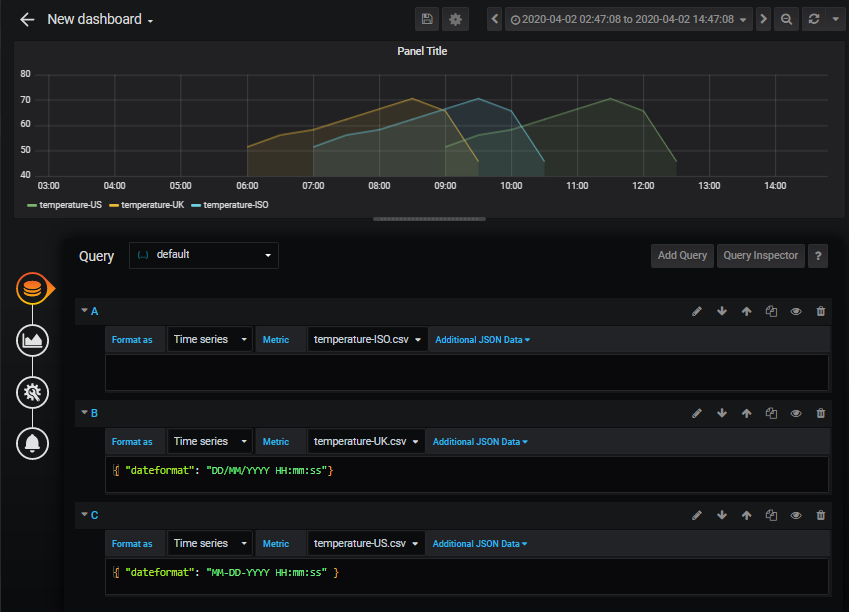
This is what I'm talking about - to get 2 lines on the graph, I have to add 2 separate queries, each returning a single timeseries dataset.
[image: image.png]
I haven't looked into the data set source project, but am I missing something?
On Wed, Apr 1, 2020 at 4:49 PM ldti notifications@github.com wrote:
I can only give you a sample of another project that seems to be doing something similar: https://github.com/pomber/covid19
And then this converts it to grafana appropriate JSON: https://github.com/twei55/covid19-grafana-datasource
— You are receiving this because you commented. Reply to this email directly, view it on GitHub https://github.com/michaeldmoore/CSVServer/issues/8#issuecomment-607330826, or unsubscribe https://github.com/notifications/unsubscribe-auth/AA4NLLV2WJNH3F4HVYOIVF3RKNPBTANCNFSM4LZCEWAQ .
-- "That's not grey - I've just come from San Francisco with some flour in my hair"
I haven't looked too deeply into the code (mostly because I can't code at all). Is the first link based on a re-iteration of reading two columns each time?
Closing this issue - we're talking about limitations in Grafana's timeseries format which has nothing to do with CSVServer.
What we CAN do in regard to multiple data sets in a single (graph) panel, is to add multiple queries, like this: (note in this example, I'm overriding the dateformat to support the default ISO-dates, plus date-first UK formatted dates and month-first US formatted dates.
Hey. Is is possible to add multiple values per row in time series mode? right now i can see it only parses the first column after date/time.