 DanielLyleWilliamWarren
commented
2 years ago
DanielLyleWilliamWarren
commented
2 years ago Card scaffolding complete
Open pautva opened 2 years ago
DanielLyleWilliamWarren
commented
2 years ago Card scaffolding complete
Status
Work in progress.
User story
As a nutritionist, I want to compare nutrient availability per person under different scenarios.
Screenshot
Chart tab
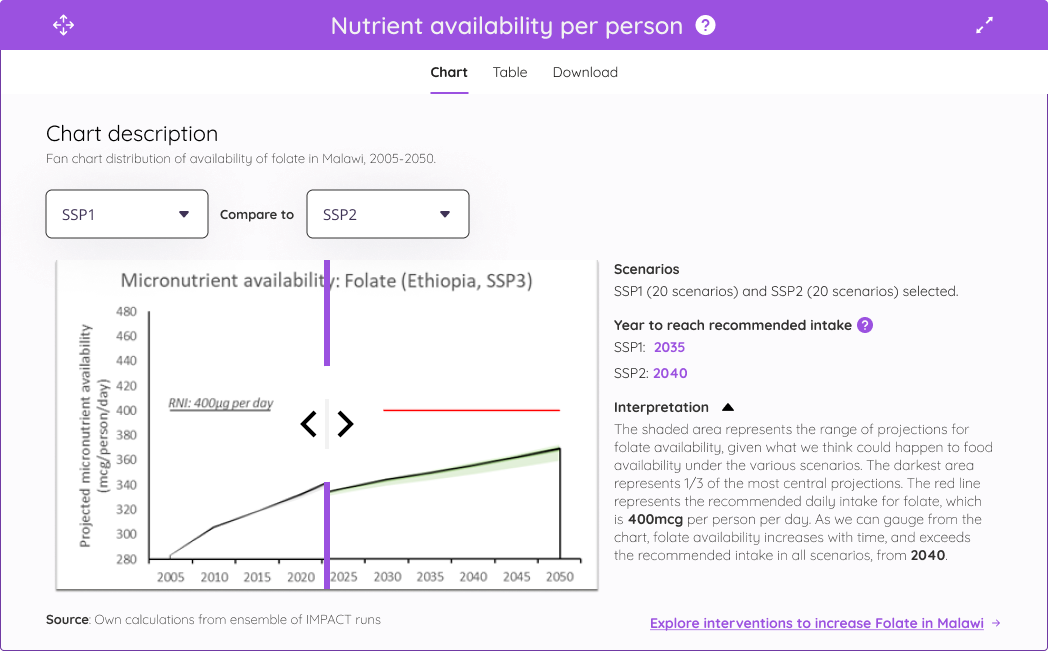
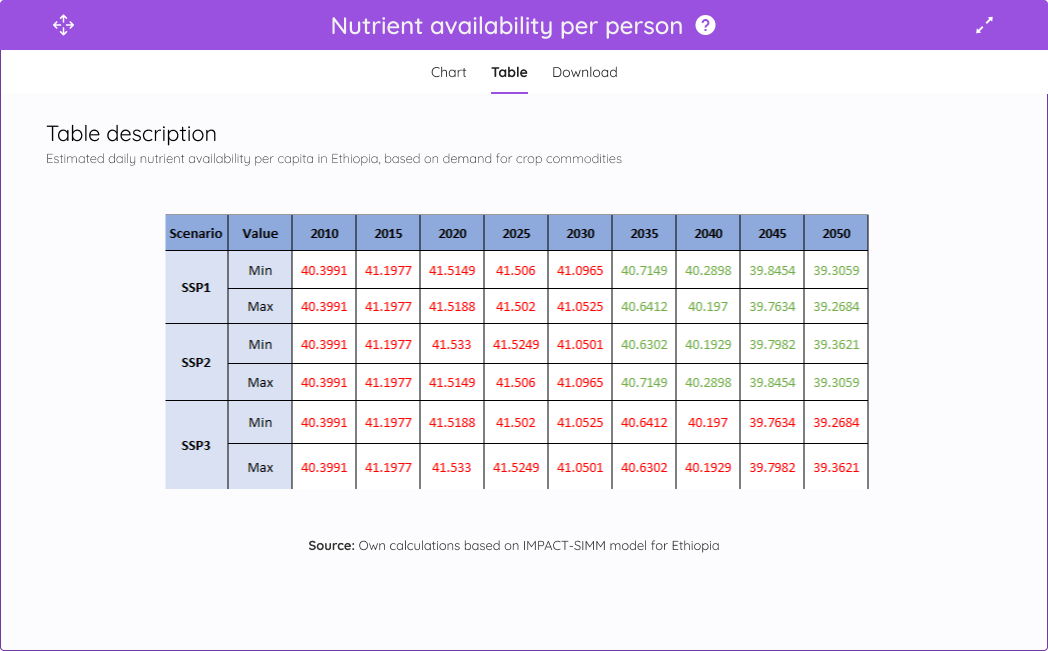
Table tab
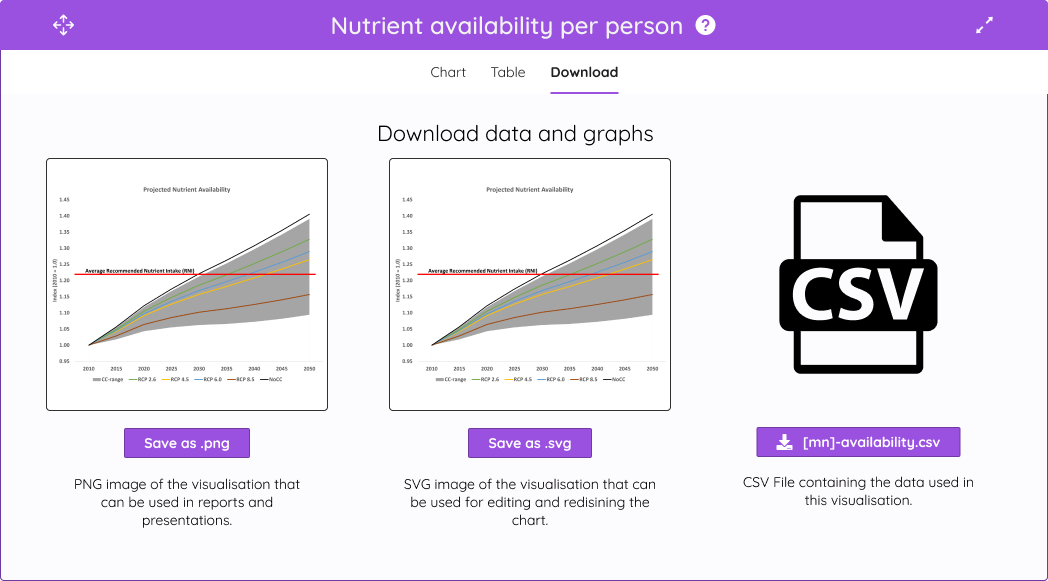
Download tab
Description
This card should allow users to compare individual scenarios to each other either in a chart view or table view. In the fan chart, you can compare 2 scenarios, in the table - all scenarios.
The scenarios displayed in the nutrient availability card are dependent on the selection in the Summary card (#786). It will be either socioeconomic, climate or all scenarios.
Chart
If socio-economic scenarios are selected, only SSP scenarios will be available for comparison.
If climate scenarios are selected - only, RCP scenarios will be available for comparison.
I all scenarios are selected, then the comparison is not available, and only a single chart is visible.
Table
The table displays selected micronutrient projections under different scenarios. It is similar to the mini-table in the Summary card (#786), but includes more details.
View table

Green values - intake above the recommended intake level Red values - intake below the recommended intake level
Download tab
Users should be able to download:
Success criteria
Chart
Table
Download
Related issues
784
785
786
792