 khmakoto
commented
2 weeks ago
khmakoto
commented
2 weeks ago FYI @AtishayMsft
Open Gabnight opened 2 weeks ago
khmakoto
commented
2 weeks ago FYI @AtishayMsft
 AtishayMsft
commented
1 week ago
AtishayMsft
commented
1 week ago @Gabnight You can refer to the documentation https://microsoft.github.io/fluentui-charting-contrib/docs/creating-date-objects-for-chart-data to provide the date object in correct format. In short you need to append the 'Z' literal to the date object like '2020-03-05T00:00:00.000Z'.
Any other format is considered as non standard and does not align with the x axis ticks.
Your second issue for custom date value formatting is not clear. Could you state with examples what is your expected behavior.
 Gabnight
commented
1 week ago
Gabnight
commented
1 week ago Hello @AtishayMsft
Creating new date object without the "Z" at the end is a valid way to create date from local time zone: Here is an exemple from the doc you mention:
Local time All other formats (including the above date-time form of the ISO format when the time zone offset is absent) are interpreted as local time. Notice how the components in the input string don't completely match those in the output ISO string. console.log(new Date('2010-10-10T02:10').toISOString()) // Output (IST): "2010-10-09T20:40:00.000Z" // Output (PDT): "2010-10-10T09:10:00.000Z"
Various components can be omitted, so the following are all valid: Date-only form: YYYY, YYYY-MM, YYYY-MM-DD Date-time form: one of the above date-only forms, followed by T, followed by HH:mm, HH:mm:ss, or HH:mm:ss.sss. Each combination can be followed by a time zone offset. For example, "2011-10-10" (date-only form), "2011-10-10T14:48:00" (date-time form), or "2011-10-10T14:48:00.000+09:00" (date-time form with milliseconds and time zone) are all valid date time strings.
If you prefer, new Date("2020-03-05T00:00:00.000") is equal to new Date(2020, 2, 5).
Moreover, as i explain in the bug, you can repro this issue in the react-charting demo website in the section "LineChart custom date axis locale" when you access the website in a local time zone different from UTC:
https://developer.microsoft.com/en-us/fluentui#/controls/web/linechart
For those reason, I'm reopening the issue. Feel free to ask me more info if you need to.
Gabnight
commented
1 week ago @AtishayMsft
I'm not able to re-open the issue. Can you re-open this issue, please?
Otherwise, I'll have to create a new issue.
AtishayMsft
commented
2 days ago @Gabnight Yes, you are correct. You can create a date object without passing the 'Z' literal and it would be interpreted in the browser local time zone. Based on different timezones in browser users will see the x axis alignment shifted to left or right. Is this what you want?
We recommend specifying the date value in UTC format so that the chart representation is uniform for users across timezones.
Library
React / v8 (@fluentui/react)
System Info
Are you reporting Accessibility issue?
None
Reproduction
https://codepen.io/Gabnight/pen/wvZLroo
Bug Description
Actual Behavior
When creating point in local time zone (GMT +1 in the example) for line chart or area chart. Ex: { x: new Date('2020-03-04T00:00:00.000'), xAxisCalloutData: new Date('2020-03-04T00:00:00.000'), y: 284000, }, The x axis tick is set at 1 am with GMT +1 which make weird UI because the tick is not aligned with the point. Moreover, the localization of the date is broken because we need a date at midnight to display the day instead of hour on the customDateTimeFormatter callback method. It seems the date passed to the chart is handled as UTC even if GMT +1 value is specified in it.
Screenshot: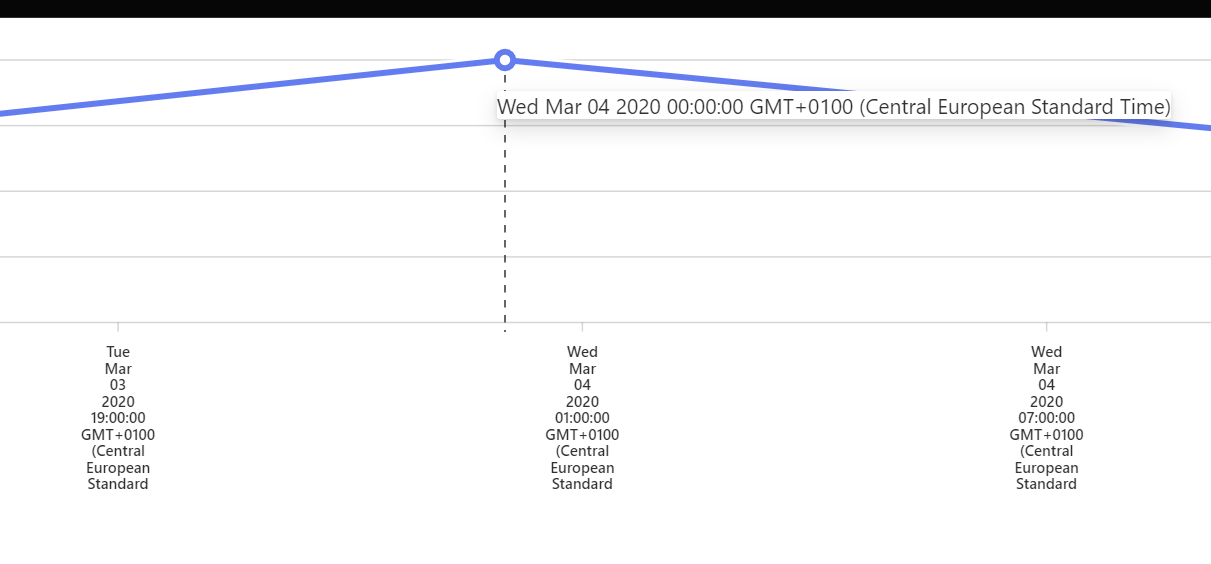
Expected Behavior
point and tick should be aligned at midnight.
Note: This bug is also visible in the React-charting demo website: https://developer.microsoft.com/en-us/fluentui#/controls/web/linechart
This regression seems to have been brought about by this change: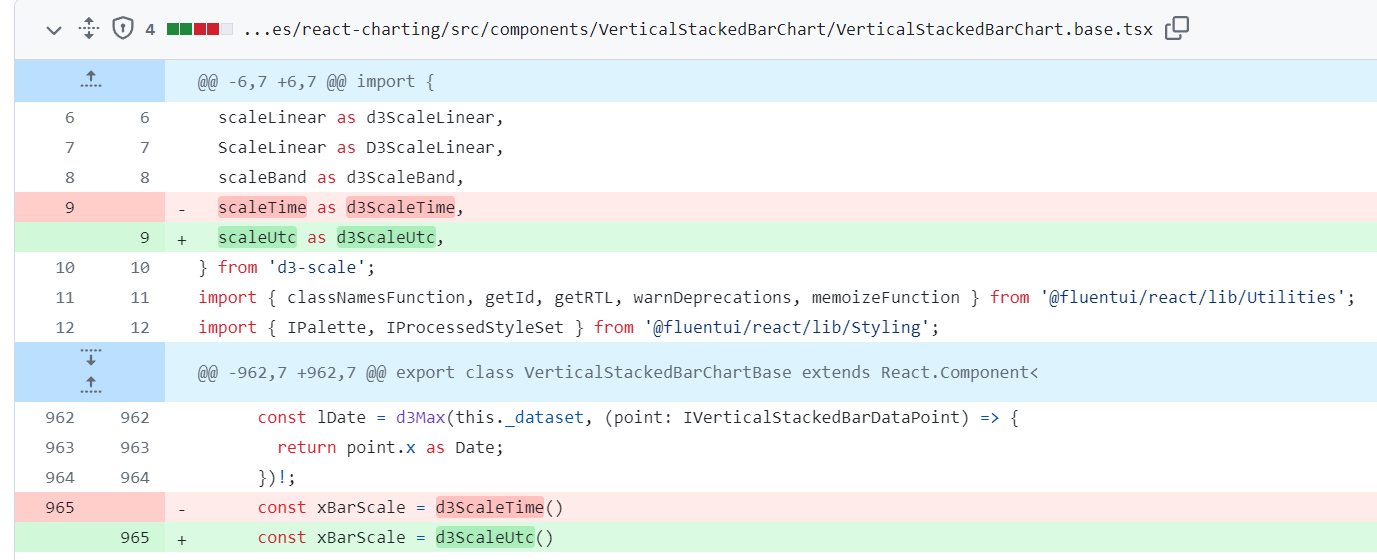 in the PR:
https://github.com/microsoft/fluentui/pull/30315/
in the PR:
https://github.com/microsoft/fluentui/pull/30315/
Logs
No response
Requested priority
High
Products/sites affected
make.powerautomate.com
Are you willing to submit a PR to fix?
no
Validations