microsoft / vscode-cpptools

Official repository for the Microsoft C/C++ extension for VS Code.
Other
5.53k stars 1.56k forks source link

(MacOS High Sierra) ERROR: Unable to start debugging. Unexpected LLDB output from command "-exec-run". Command 'exec-run'. Invalid process during debug session #2276

Open maane018 opened 6 years ago

maane018 commented 6 years ago

Type: Debugger OS: MacOS Version: 10.13.6 Debugger: LLDB

launch.json:

    // Use IntelliSense to learn about possible attributes.
    // Hover to view descriptions of existing attributes.
    // For more information, visit: https://go.microsoft.com/fwlink/?linkid=830387
    "version": "0.2.0",
    "configurations": [
        {
            "name": "(lldb) Launch",
            "type": "cppdbg",
            "request": "launch",
            "program": "${workspaceFolder}/a.out",
            "args": [],
            "stopAtEntry": false,
            "cwd": "${workspaceFolder}",
            "environment": [],
            "externalConsole": true,
            "preLaunchTask": "echo",
            "MIMode": "lldb",
            "logging": { "engineLogging": true }
        }
    ]
}

Logs:

1: (284) LaunchOptions  ExePath='/Users/hgarg/testing-vscode/a.out'
1: (284) LaunchOptions  WorkingDirectory='/Users/hgarg/testing-vscode'
1: (284) LaunchOptions  ExeArguments=''
1: (284) LaunchOptions MIMode='lldb'
1: (284) LaunchOptions  MIDebuggerPath='/Users/hgarg/.vscode/extensions/ms-vscode.cpptools-0.17.6/debugAdapters/lldb/bin/lldb-mi'
1: (284) LaunchOptions  WaitDynamicLibLoad='false'
1: (284) LaunchOptions  ExternalConsole='true'
1: (284) LaunchOptions>
1: (285) LaunchOptions</LocalLaunchOptions>
1: (388) Starting: "/Users/hgarg/.vscode/extensions/ms-vscode.cpptools-0.17.6/debugAdapters/lldb/bin/lldb-mi" --interpreter=mi
1: (407) DebuggerPid=61512
1: (575) ->(gdb)
1: (589) <-1001-gdb-set solib-search-path "/Users/hgarg/testing-vscode:"
1: (589) ->1001^done
1: (589) ->(gdb)
1: (591) 1001: elapsed time 3
1: (592) <-1002-environment-cd /Users/hgarg/testing-vscode
1: (592) ->1002^done,path="/Users/hgarg/testing-vscode"
1: (593) ->(gdb)
1: (596) 1002: elapsed time 3
1: (596) <-1003-gdb-set new-console on
1: (596) ->1003^done
1: (596) 1003: elapsed time 0
1: (596) <-1004-file-exec-and-symbols /Users/hgarg/testing-vscode/a.out
1: (597) ->(gdb)
1: (601) STDERR: Traceback (most recent call last):
1: (601) STDERR:   File "<input>", line 1, in <module>
1: (601) STDERR:   File "/Users/hgarg/anaconda2/lib/python2.7/copy.py", line 52, in <module>
1: (601) STDERR:     import weakref
1: (601) STDERR:   File "/Users/hgarg/anaconda2/lib/python2.7/weakref.py", line 14, in <module>
1: (601) STDERR:     from _weakref import (
1: (601) STDERR: ImportError: cannot import name _remove_dead_weakref
1: (679) ->1004^done
1: (679) ->(gdb)
1: (679) 1004: elapsed time 82
1: (679) ->=library-loaded,id="/Users/hgarg/testing-vscode/a.out",target-name="/Users/hgarg/testing-vscode/a.out",host-name="/Users/hgarg/testing-vscode/a.out",symbols-loaded="1",symbols-path="/Users/hgarg/testing-vscode/a.out.dSYM/Contents/Resources/DWARF/a.out",loaded_addr="-",size="8192"
1: (681) <-1005-interpreter-exec console "platform status"
1: (681) ->  Platform: host
1: (681) ->    Triple: x86_64h-apple-macosx
1: (681) ->OS Version: 10.13.6 (17G65)
1: (681) ->    Kernel: Darwin Kernel Version 17.7.0: Thu Jun 21 22:53:14 PDT 2018; root:xnu-4570.71.2~1/RELEASE_X86_64
1: (681) ->  Hostname: 127.0.0.1
1: (681) ->WorkingDir: /Users/hgarg/testing-vscode
1: (681) ->1005^done
1: (681) ->(gdb)
1: (684) 1005: elapsed time 3
1: (688) <-1006-break-insert main
1: (690) ->1006^done,bkpt={number="1",type="breakpoint",disp="keep",enabled="y",addr="0x000000010000108a",func="main",file="main.cpp",fullname="/Users/hgarg/testing-vscode/main.cpp",line="5",times="0",original-location="main"}
1: (690) ->(gdb)
1: (690) ->=breakpoint-modified,bkpt={number="1",type="breakpoint",disp="keep",enabled="y",addr="0x000000010000108a",func="main",file="main.cpp",fullname="/Users/hgarg/testing-vscode/main.cpp",line="5",times="0",original-location="main"}

1: (691) 1006: elapsed time 2
Warning: Debuggee TargetArchitecture not detected, assuming x86_64.
1: (741) <-1007-exec-run
1: (5253) ->1007^error,msg="Command 'exec-run'. Invalid process during debug session"
1: (5253) 1007: elapsed time 4512
1: (5253) ->(gdb)
ERROR: Unable to start debugging. Unexpected LLDB output from command "-exec-run". Command 'exec-run'. Invalid process during debug session
1: (5270) <--gdb-exit
1: (5271) ->^exit
1: (5271) ->=thread-group-exited,id="i1"
1: (5271) ->(gdb)
1: (5271) ->
1: (5272) ->
1: (5275) <-logout
The program '/Users/hgarg/testing-vscode/a.out' has exited with code 42 (0x0000002a).

Folder Structure: screen shot 2018-07-16 at 11 14 27 am

pieandcakes commented 6 years ago

@maane018 can you share how you compiled this and which version of the compiler you are using? The error shows: 1: (741) <-1007-exec-run 1: (5253) ->1007^error,msg="Command 'exec-run'. Invalid process during debug session".

Also do you have python 2.7 installed? I'm showing this error from lldb also:

1: (601) STDERR: Traceback (most recent call last):
1: (601) STDERR:   File "<input>", line 1, in <module>
1: (601) STDERR:   File "/Users/hgarg/anaconda2/lib/python2.7/copy.py", line 52, in <module>
1: (601) STDERR:     import weakref
1: (601) STDERR:   File "/Users/hgarg/anaconda2/lib/python2.7/weakref.py", line 14, in <module>
1: (601) STDERR:     from _weakref import (
1: (601) STDERR: ImportError: cannot import name _remove_dead_weakref
maane018 commented 6 years ago

Hi @pieandcakes Here is my tasks.json

{
    // See https://go.microsoft.com/fwlink/?LinkId=733558
    // for the documentation about the tasks.json format
    "version": "2.0.0",
    "tasks": [
        {
            "label": "echo",
            "type": "shell",
            "command": "g++",
            "args": [
                "-g",
                "main.cpp"
            ],
            "group": {
                "kind": "build",
                "isDefault": true
            }
        }
    ]
}
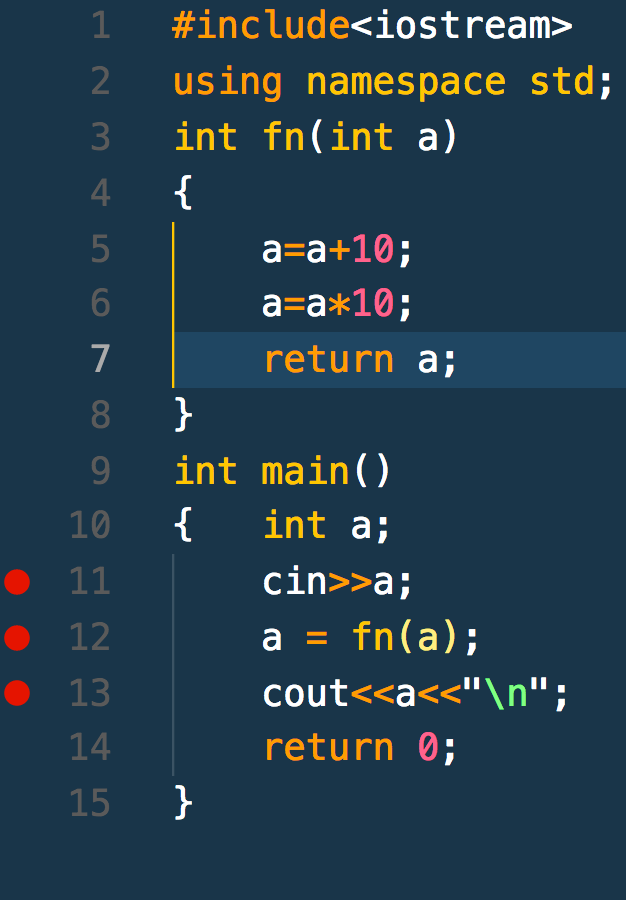
screen shot 2018-07-17 at 11 02 37 am

Code is running perfectly.

But when I am trying to debug the program using breakpoints:

screen shot 2018-07-17 at 11 03 17 am

and I debug the program, I got these logs:

1: (674) STDERR: Traceback (most recent call last):
1: (675) STDERR:   File "<input>", line 1, in <module>
1: (675) STDERR:   File "/Users/hgarg/anaconda2/lib/python2.7/copy.py", line 52, in <module>
1: (675) STDERR:     import weakref
1: (675) STDERR:   File "/Users/hgarg/anaconda2/lib/python2.7/weakref.py", line 14, in <module>
1: (675) STDERR:     from _weakref import (
1: (675) STDERR: ImportError: cannot import name _remove_dead_weakref
1: (788) ->1004^done
1: (788) ->(gdb)
1: (788) 1004: elapsed time 120
1: (789) ->=library-loaded,id="/Users/hgarg/testing-vscode/a.out",target-name="/Users/hgarg/testing-vscode/a.out",host-name="/Users/hgarg/testing-vscode/a.out",symbols-loaded="1",symbols-path="/Users/hgarg/testing-vscode/a.out.dSYM/Contents/Resources/DWARF/a.out",loaded_addr="-",size="8192"
1: (791) <-1005-interpreter-exec console "platform status"
1: (792) ->  Platform: host
1: (792) ->    Triple: x86_64h-apple-macosx
1: (792) ->OS Version: 10.13.6 (17G65)
1: (792) ->    Kernel: Darwin Kernel Version 17.7.0: Thu Jun 21 22:53:14 PDT 2018; root:xnu-4570.71.2~1/RELEASE_X86_64
1: (792) ->  Hostname: 127.0.0.1
1: (792) ->WorkingDir: /Users/hgarg/testing-vscode
1: (792) ->1005^done
1: (792) ->(gdb)
1: (794) 1005: elapsed time 3
1: (799) <-1006-break-insert main
1: (802) ->1006^done,bkpt={number="1",type="breakpoint",disp="keep",enabled="y",addr="0x00000001000010ba",func="main",file="main.cpp",fullname="/Users/hgarg/testing-vscode/main.cpp",line="11",times="0",original-location="main"}
1: (803) ->(gdb)
1: (803) ->=breakpoint-modified,bkpt={number="1",type="breakpoint",disp="keep",enabled="y",addr="0x00000001000010ba",func="main",file="main.cpp",fullname="/Users/hgarg/testing-vscode/main.cpp",line="11",times="0",original-location="main"}
1: (803) ->(gdb)
1: (804) 1006: elapsed time 4
1: (917) <-1007-break-insert -f on main.cpp:11
1: (918) ->1007^done,bkpt={number="2",type="breakpoint",disp="keep",enabled="y",addr="0x00000001000010ba",func="main",file="main.cpp",fullname="/Users/hgarg/testing-vscode/main.cpp",line="11",pending=["main.cpp:11"],times="0",original-location="main.cpp:11"}
1: (918) ->(gdb)
1: (919) ->=breakpoint-modified,bkpt={number="2",type="breakpoint",disp="keep",enabled="y",addr="0x00000001000010ba",func="main",file="main.cpp",fullname="/Users/hgarg/testing-vscode/main.cpp",line="11",pending=["main.cpp:11"],times="0",original-location="main.cpp:11"}
1: (919) ->(gdb)
1: (920) 1007: elapsed time 3
1: (939) <-1008-break-insert -f on main.cpp:12
1: (940) ->1008^done,bkpt={number="3",type="breakpoint",disp="keep",enabled="y",addr="0x00000001000010bf",func="main",file="main.cpp",fullname="/Users/hgarg/testing-vscode/main.cpp",line="12",pending=["main.cpp:12"],times="0",original-location="main.cpp:12"}
1: (940) 1008: elapsed time 0
1: (940) ->(gdb)
1: (940) ->=breakpoint-modified,bkpt={number="3",type="breakpoint",disp="keep",enabled="y",addr="0x00000001000010bf",func="main",file="main.cpp",fullname="/Users/hgarg/testing-vscode/main.cpp",line="12",pending=["main.cpp:12"],times="0",original-location="main.cpp:12"}
1: (940) ->(gdb)
1: (941) <-1009-break-insert -f on main.cpp:13
1: (942) ->1009^done,bkpt={number="4",type="breakpoint",disp="keep",enabled="y",addr="0x00000001000010d5",func="main",file="main.cpp",fullname="/Users/hgarg/testing-vscode/main.cpp",line="13",pending=["main.cpp:13"],times="0",original-location="main.cpp:13"}
1: (943) 1009: elapsed time 1
1: (943) ->(gdb)
1: (943) ->=breakpoint-modified,bkpt={number="4",type="breakpoint",disp="keep",enabled="y",addr="0x00000001000010d5",func="main",file="main.cpp",fullname="/Users/hgarg/testing-vscode/main.cpp",line="13",pending=["main.cpp:13"],times="0",original-location="main.cpp:13"}
1: (943) ->(gdb)
Warning: Debuggee TargetArchitecture not detected, assuming x86_64.
1: (972) <-1010-exec-run
1: (2970) ->1010^error,msg="Command 'exec-run'. Invalid process during debug session"
1: (2970) ->(gdb)
1: (2970) 1010: elapsed time 1997
ERROR: Unable to start debugging. Unexpected LLDB output from command "-exec-run". Command 'exec-run'. Invalid process during debug session
1: (2984) <--gdb-exit
1: (2984) ->^exit
1: (2984) ->=thread-group-exited,id="i1"
1: (2984) ->(gdb)
1: (2985) ->
1: (2985) ->
1: (2986) <-logout
The program '/Users/hgarg/testing-vscode/a.out' has exited with code 42 (0x0000002a).

Along with that, my terminal got opened and without asking for anything, it returned the following output:

Launching: '/Users/hgarg/testing-vscode/a.out'
Working directory: '/Users/hgarg/testing-vscode'
1 arguments:
argv[0] = '/Users/hgarg/testing-vscode/a.out'
Trace/BPT trap: 5
Process exited with status 133
logout
Saving session...
...copying shared history...
...saving history...truncating history files...
...completed.

[Process completed]

and I am using G++ Compiler:

Configured with: --prefix=/Library/Developer/CommandLineTools/usr --with-gxx-include-dir=/usr/include/c++/4.2.1
Apple LLVM version 9.1.0 (clang-902.0.39.2)
Target: x86_64-apple-darwin17.7.0
Thread model: posix
InstalledDir: /Library/Developer/CommandLineTools/usr/bin

Also, I don't have Python 2.7 installed in this directory. Do you have any idea why it is looking for Python libraries during debugging?

pieandcakes commented 6 years ago

@WardenGnaw Can you repro this for us?

pieandcakes commented 6 years ago

@maane018

Also, I don't have Python 2.7 installed in this directory. Do you have any idea why it is looking for Python libraries during debugging?

We had requests to support Python Visualizers in our lldb so it requires python to be installed. Unfortunately this is a compile time option and we don't have an option currently to install lldb without python.

maane018 commented 6 years ago

@pieandcakes Okay. I will try it again, by changing the python version. There are actually 2 errors during debugging. One is sometimes it fails to debug also ( which is I think is due to the Python libraries ) and second, it fails to get input from terminal. Do you have any idea why it fails to get input?

pieandcakes commented 6 years ago

@maane018

Do you have any idea why it fails to get input?

If you type in the terminal that pops up it should get your input

Process exited with status 133

That shows in your terminal window so i'm wondering why your app is terminating with code 133

aziabari commented 5 years ago

Any solution in here??

I have tried the simple calculator in this video: https://www.youtube.com/watch?v=X7CXjKGi_ro

and got the same error! When I don't try a prelaunchTask, debugging works just fine but when I use a preLaunchTask it will produce exactly the same errors!!

Thanks

ulchie commented 5 years ago

I'm getting this same problem. For me, it looks to be a timing issue. The debugger invocation is occurring before the preLaunchTask has finished. Subsequent invocations of the debugger (via F5) work fine for me, but the initial invocation after a clean build always fails. I am admittedly working on a very small project, so it may be the case that other users have preLaunchTasks that are still in progress irrespective of whether a clean build occurred or not, and perhaps those tasks are affecting the binary the debugger is attempting to launch.

WardenGnaw commented 5 years ago

@aziabari and @Ulchie Thanks for the updated info. The cpptools extension does not handle the prelaunch task, and if VS Code launches the debugger without the prelaunch task finishing, that would be an issue on their end.

Another user is encountering this issue with the node debugger: https://github.com/Microsoft/vscode/issues/69151

WardenGnaw commented 4 years ago

@maane018 This might be a permission issue with the debugger executables.

Can you do ls -al on ~/.vscode/extensions/ms-vscode.cpptools-<version>/debugAdapters/lldb/bin/

sourav-dey commented 4 years ago

I am also having the same problem. I followed: https://code.visualstudio.com/docs/cpp/config-clang-mac I need to run it twice or thrice sometimes to make it run successfully.

❯ ls -al ~/.vscode/extensions/ms-vscode.cpptools-0.27.0-insiders2/debugAdapters/lldb-mi/bin [11:49:29] total 5576 drwxr-xr-x 3 sodey 600 96 Mar 5 15:43 . drwxr-xr-x 4 sodey 600 128 Mar 5 15:43 .. -rwxr-xr-x 1 sodey 600 2853804 Mar 5 15:43 lldb-mi

WardenGnaw commented 4 years ago

@sourav-dey Could you make another issue on this and also share your tasks.json and launch.json?

sourav-dey commented 4 years ago

Sure. Here it is: https://github.com/microsoft/vscode-cpptools/issues/5079

lmapii commented 4 years ago

any news on this one? can't debug anymore :( Unable to start debugging. Unexpected LLDB output from command "-exec-run". Command 'exec-run'. Invalid process during debug session Developer mode is already enabled.

peza8 commented 4 years ago

Exact same issue as @lmapii

WardenGnaw commented 4 years ago

@lmapii @peza8 Are you having issues debugging on macOS High Sierra?

lmapii commented 4 years ago

@WardenGnaw no, this was on mac os catalina 10.15.4. i'm with @Ulchie on this one - this seems to be a timing issue. i know how ridiculous this sounds but the problem disappeared at some point (i haven't changed anything in the installation). meaning the famous sentence "i didn't do anything" seems to apply :/

peza8 commented 4 years ago

@WardenGnaw Experiencing issue on Catalina 10.15.2. Sadly haven't had the same luck as Imapii. Happy to do any tests you need @WardenGnaw .

WardenGnaw commented 4 years ago

@lmapii @peza8 Hiding comments here and moving them to https://github.com/microsoft/vscode-cpptools/issues/5079