 jrieken
commented
5 years ago
jrieken
commented
5 years ago @iyashpal We are really keen on nailing down this issue but we have been unable to reproduce yet. Can you please create CPU profile when things get slow. With that we can get a fix.
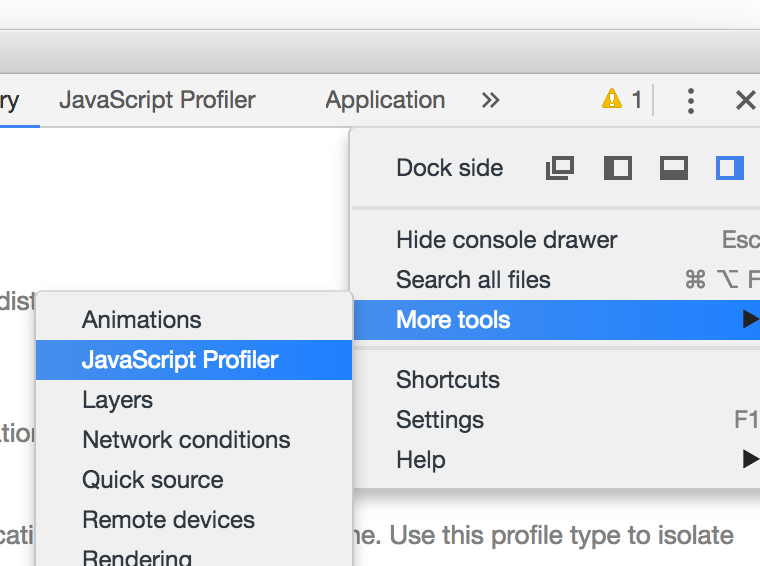
To create profile, do this: Hit F1 > Toggle Developer Tools. In the overflow menu select 'More Tools > JavaScript Profiler'. In there select start, let it profile for 30 to 60 seconds, stop it, save it to a file and attach the file here. Thanks.
 UweKeim
 rtemision

 chrmarti
 vitorsemeano
 yyss8
yyss8
 iyashpal
 artdude543
Steps to Reproduce:
Extensions Installed:
Does this issue occur when all extensions are disabled?: Yes/No Yes