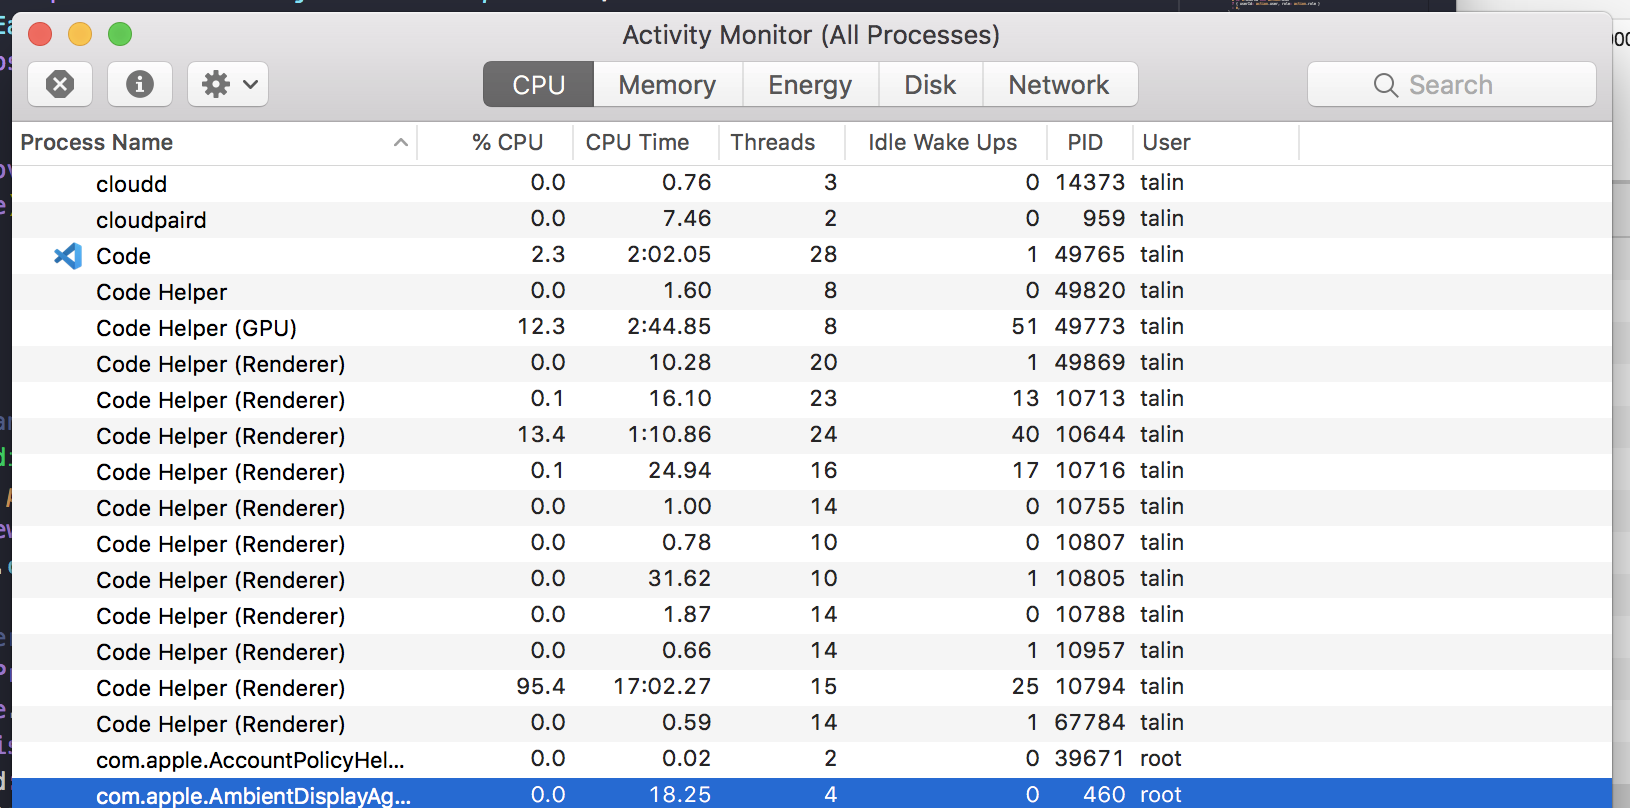
What file types besides php are open when this happens?
Closed antoniofarina closed 4 years ago
What file types besides php are open when this happens?
/needsMoreInfo
@kieferrm I have been experiencing the same issue after upgrading this morning. But the CPU usage climbs well past 100% without having to open any files at all. After 15 seconds the usage jumped to 151%


Version: 1.45.1 Commit: 5763d909d5f12fe19f215cbfdd29a91c0fa9208a Date: 2020-05-14T08:33:47.663Z Electron: 7.2.4 Chrome: 78.0.3904.130 Node.js: 12.8.1 V8: 7.8.279.23-electron.0 OS: Darwin x64 19.4.0
aaron-bond.better-comments adrianwilczynski.asp-net-core-switcher alexdima.copy-relative-path Angular.ng-template anseki.vscode-color christian-kohler.path-intellisense codezombiech.gitignore CoenraadS.bracket-pair-colorizer craigthomas.supersharp cstrap.flask-snippets Dart-Code.dart-code Dart-Code.flutter dbaeumer.vscode-eslint doggy8088.netcore-extension-pack doggy8088.netcore-snippets dsznajder.es7-react-js-snippets EditorConfig.EditorConfig eg2.vscode-npm-script esbenp.prettier-vscode felipe.nasc-touchbar fivethree.vscode-ionic-snippets formulahendry.auto-close-tag formulahendry.auto-rename-tag formulahendry.dotnet formulahendry.dotnet-test-explorer Gruntfuggly.todo-tree jchannon.csharpextensions jmrog.vscode-nuget-package-manager johnpapa.angular-essentials johnpapa.Angular2 johnpapa.vscode-peacock johnpapa.winteriscoming k--kato.docomment Leopotam.csharpfixformat ms-azuretools.vscode-docker ms-dotnettools.csharp ms-mssql.mssql ms-python.python ms-vscode.vscode-typescript-tslint-plugin ms-vsliveshare.vsliveshare msjsdiag.debugger-for-chrome msjsdiag.debugger-for-edge msjsdiag.vscode-react-native natewallace.angular2-inline nrwl.angular-console octref.vetur PKief.material-icon-theme quicktype.quicktype ritwickdey.LiveServer schneiderpat.aspnet-helper sdras.vue-vscode-snippets tintoy.msbuild-project-tools VisualStudioExptTeam.vscodeintellicode wayou.vscode-todo-highlight whizkydee.material-palenight-theme
Update, it calms right back down after about 15 or so minutes
I also have been seeing this issue on 1.45.1. I don't notice it subsiding after 15 minutes, it seems to go on for much longer, and I don't see a particular pattern.
Also, I notice that Code Helper (Renderer) continues to run at 90-100% even after quitting VSCode.
I am also seeing Code Helper (Renderer) continuing to consume CPU even after quitting out of vscode. It appears to be pinning 1 core at 100% (maybe stuck in a sync loop and not responding to graceful exit signal?).
i have had the same issue for the past week. Code Helper Renderer makes CPU stuck at 100% and stays open after quitting VSCode.
My Macbook has never been so hot as this past week, i'm getting scared.
@mesqueeb @ggoodman @markedwards pls file separate issue with a performance profile by following the steps described here https://github.com/microsoft/vscode/wiki/Performance-Issues
@egamma I haven't had the issue since I posted here, so I can't repro at the moment. If it comes back I will file a separate issue.
Exact same thing happens to me when I run gatsby develop from the VSCode terminal.

I have 64GB of ram on 16 inch Macbook pro, but when this happens, I see completely broken intellisense. Only fix is to quit and re-open VSCode.

The CodeHelper process is running extensions and typically it is the extensions that cause the high CPU load. To help to narrow this down please follow this guide https://github.com/microsoft/vscode/wiki/Performance-Issues.
This issue has been closed automatically because it needs more information and has not had recent activity. See also our issue reporting guidelines.
Happy Coding!
I experience this issue frequently. I have started habitually terminating the code help renderer process about once a day, since that is about how long it takes for the problem to manifest. Sometimes I see multiple copies of the renderer process - usually after I switch between several projects.

Also experiencing this, anyone have ideas on how to debug / see what part of VSCode is causing this demand?
I am also facing this issue. Not sure what is the solution. I verified that the search excludes
"search.exclude": {
  "**/node_modules": true,
  "**/bower_components": true,
  "**/*.code-search": true
}

"files.exclude": {
  "**/node_modules": true
}To extend what @sashwatp said (as I'm encountering the same issue recently), I added the following to my files/search exclusion in case some background process is trying to index them:
**/.next (nextjs)**/.cache (parcel)**/dev**/dist I get this problem only with a project that uses SVN. All my Git projects are cool. Pun intended, because the SVN project makes my Mac nice and toasty, currently Code Helper (Renderer) is using 234% CPU!
SOLVED IT! (At least for me.) I take back my SVN accusation. That wasn't it. Code Helper (Renderer) became a CPU hog for me only when the project I was working on had two recursive symbolic links that pointed to the same place (note: not my design). At first I thought it might be the occurrence of any recursive symlink but VS Code handles one of those just fine. But have a directory structure like this:
A
    B1
        abc -> ../..
    B2
        abc -> ../..
and you'll see a Code Helper (Renderer) apparently get stuck in a double infinite loop and turn your computer into a room heater.
I suspect this means that VS Code is smart enough to catch itself in a single infinite symlink loop but having two interacting loops lets it alternate back and forth ad infinitum!
I've also started to see this after using npm link, which creates symbolic links. This issue should be re-opened.
Issue Type: Performance Issue
When VS Code runs for a long time, the process Code Helper eat 100% of the CPU
VS Code version: Code 1.45.1 (5763d909d5f12fe19f215cbfdd29a91c0fa9208a, 2020-05-14T08:33:47.663Z) OS version: Darwin x64 19.4.0
System Info
|Item|Value| |---|---| |CPUs|Intel(R) Core(TM) i5-8257U CPU @ 1.40GHz (8 x 1400)| |GPU Status|2d_canvas: enabledflash_3d: enabled
flash_stage3d: enabled
flash_stage3d_baseline: enabled
gpu_compositing: enabled
metal: disabled_off
multiple_raster_threads: enabled_on
oop_rasterization: disabled_off
protected_video_decode: unavailable_off
rasterization: enabled
skia_renderer: disabled_off_ok
video_decode: enabled
viz_display_compositor: enabled_on
viz_hit_test_surface_layer: disabled_off_ok
webgl: enabled
webgl2: enabled| |Load (avg)|3, 3, 3| |Memory (System)|16.00GB (0.48GB free)| |Process Argv|| |Screen Reader|no| |VM|0%|
Process Info
``` CPU % Mem MB PID Process 17 82 54389 code main 7 229 54391 gpu-process 0 33 54393 utility 0 131 54394 window (strings.json — translated.com) 1 49 54950 extensionHost 0 0 56094 electron_node tsserver.js 0 16 56096 electron_node tsserver.js 0 0 56132 electron_node typingsInstaller.js typesMap.js 0 16 56106 electron_node eslintServer.js 0 0 56147 electron_node server.js 0 0 56148 /usr/local/opt/php@7.3/bin/php /Users/antonio/.vscode/extensions/felixfbecker.php-intellisense-2.3.14/vendor/felixfbecker/language-server/bin/php-language-server.php --tcp=127.0.0.1:59272 --memory-limit=4095M 0 0 54951 /bin/zsh -l 0 0 55267 watcherService 53 66 54947 shared-process 0 311 56320 window (Settings — marketing) 1 82 56323 extensionHost 0 246 56495 php /Users/antonio/.vscode/extensions/felixfbecker.php-intellisense-2.3.14/vendor/felixfbecker/language-server/bin/php-language-server.php --tcp=127.0.0.1:59317 --memory-limit=4095M 96 16 56509 electron_node server.js 0 0 63144 electron_node server.js 0 0 56324 /bin/zsh -l 0 16 56388 watcherService ```Extensions (16)
Extension|Author (truncated)|Version ---|---|--- better-toml|bun|0.3.2 vscode-svgviewer|css|2.0.0 vscode-eslint|dba|2.1.5 gitlens|eam|10.2.1 php-debug|fel|1.13.0 php-intellisense|fel|2.3.14 php-pack|fel|1.0.2 vscode-test-explorer|hbe|2.18.1 composer|ika|0.7.1 php-cs-fixer|jun|0.1.153 git-graph|mhu|1.22.0 dotenv|mik|1.0.1 vscode-docker|ms-|1.2.0 sublime-keybindings|ms-|4.0.7 vscode-phpunit|rec|2.0.72 phpdoc-comment-vscode-plugin|rex|1.3.0