Open mathieu-veron opened 9 years ago
Hi, this features has been discussed earlier (in 2012 !) : https://github.com/morrisjs/morris.js/issues/81 but I think a gauge graph could be done esayly by a half donnut. like :
why not adding an option to allow that rendering :
Morris.Donut({
  element: 'donut-example',
  half : true,
  data: [
    {label: "completion", value: 72},
    {label: "left to do", value: 28}
  ]
});
here I propose a half option, but this could be extended to support vertical gauge (from -180° to 0°)
http://justgage.com/
These are awesome ones
 parikh5555
commented
7 years ago parikh5555
commented
7 years ago
parikh5555
commented
7 years ago parikh5555
commented
7 years ago
Hi, this features has been discussed earlier (in 2012 !) : https://github.com/morrisjs/morris.js/issues/81 but I think a gauge graph could be done esayly by a half donnut. like :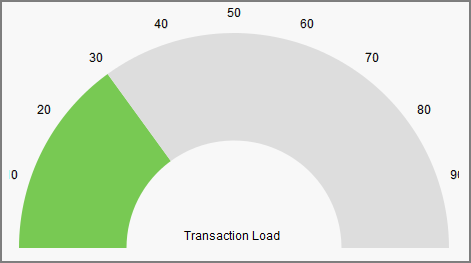
why not adding an option to allow that rendering :
here I propose a half option, but this could be extended to support vertical gauge (from -180° to 0°)