 msteinbeck
commented
9 years ago
msteinbeck
commented
9 years ago Documentation is moving ahead. Currently I'm missing:
- B-Splines to Beziers, why is it useful, how to use it, examples.
- Complete interface documentation, fix doxygen.
Closed msteinbeck closed 8 years ago
msteinbeck
commented
9 years ago Documentation is moving ahead. Currently I'm missing:
 mavavilj
commented
8 years ago
mavavilj
commented
8 years ago Yes, improve documentation.
I cannot figure out what I need to do in order to input my 2D data into tinyspline and have it return the interpolated points including and between the points that I gave into tinyspline.
msteinbeck
commented
8 years ago In the following I'm assuming you are using the C interface.
If you want to interpolate a set/list of points [x0, y0, x1, y1, x2, y2, ..., x_n, y_n] you need to use the function ts_bspline_interpolate. Let's say you have 10 points in 2D arranged as described above, then call:
float *points = ....  // your points in 2D arranged as [x0, y0, x1, y1, x2, y2, ..., x_9, y_9]
tsBSpline spline; // create the spline storing the result
tsError err = ts_bspline_interpolate(
  points, // your points
  10,      // the number of points
  2,       // the dimension of each point
  &spline
);
if (err < 0) ... // error handling
Afterwards spline represents the interpolated spline. Use ts_bspline_evaluate to evaluate spline at any points t with 0 <= t <= 1. You will find another example in interpolation.c.
If you are using C++ or any of the bindings, call the constructor instead.
mavavilj
commented
8 years ago ts_bspline_evaluate says it saves to some type tsDeBoorNet.
It's a struct (https://github.com/retuxx/tinyspline/blob/master/library/tinyspline.h#L55), but which variables represent the "y-values" and which ones "x-values" for the spline?
msteinbeck
commented
8 years ago Given the example above you can evaluate spline at any t with 0 <= t <= 1 by:
tsDeBoorNet net; // the net to store the result.
tsError err = tsError ts_bspline_evaluate(&spline, t, &net); // with 0 <= t <= 1
if (err < 0)... // error handling

net.result; // stores the resulting point arranged as [x0, y0]
Edit: Fixed [x0, x1] to [x0, y0]
mavavilj
commented
8 years ago Why is the range [0,1] and not [0, len(input points)] or similar?
msteinbeck
commented
8 years ago Why is the range [0,1] and not [0, len(input points)]?
Sorry, but I don't understand this question. Which range should be [0, len(input points)]?
mavavilj
commented
8 years ago If I'm inputting data that has say 1000 [x,y] points then the length of the data is 1000 (or more if one uses max(x) to determine the length of the data).
It would be reasonable if I could then have the spline function return max(x) or similar amount of points so that I can iterate over integers that correspond to the x-values in the input data and not decimals in range [0,1].
How do I know what x-value in the input data some x' in [0,1] corresponds to?
msteinbeck
commented
8 years ago Ok, I see your problem here. You misunderstand the usage of splines. First of all a spline is parameterized over a variable t. Usually the range of t is 0 <= t <= 1 but actually the range can be anything as long as min(t) < max(t). Evaluating a spline s at any t (with respect to t's range) returns the point p (in your case 2D) on s at t.
Wikipedia describes a B-Spline as follows:
"A B-spline of order n is a piecewise polynomial function of degree <n in a variable x. It is defined over a domain t 0 ≤ x ≤ tm, m = n. The points where x = t j are known as knots or break-points." (As you can see, Wikipedia uses another range for t but that doesn't matter here)
So, you want to interpolate a set/list of points where each x value maps to exactly one y value representing a function and afterwards you want to evaluate the spline s at any x, right?
In order to create such a function your points arranged as [x0, y0, x1, y1, x2, y2, ..., x_n, y_n] needs to be strictly monotonically increasing, such that for each value x_{n} and x_{n+1} the following equation applies: x{n} < x_{n+1}. For example:
[0, 1, 1, 1, 2, 1, 3, 1,...] <<< you see each x value is smaller than its successor.
If your points are not strictly monotonically increasing in x the resulting spline is not a function but a relation instead (you know, each x value may have many y values).
So how do we get the mapped y value of any x value for a spline s? The only (as far as I know) and fastest way is to perform the Bisection method (a binary search in continuous space). First, we begin to evaluation s at 0.5 (by using ts_bspline_evaluate) and check if net.result[0] (the x value at 0.5) is smaller, greater or equals to given x value. If net.result[0] is greater than x, evaluate s at 0.25 (mid(0, 0.5)) and if net.result[0] is smaller than x, evaluate s at 0.75 (mid(0.5, 1)). Stop this iteration if net.result[0] is equals to x. IMPORTANT: the type of points is float. Comparing floats using == isn't a smart idea in general. Though (f0 + f1) / 2 is either f0 or f1 at some point (due to imprecision of floats) the usage of ts_fequals is recommended. Finally net.result[1] is the mapping (y) of the given x.
Edit: Fixed min(t) > max(t) to min(t) < max(t), x{n} > x_{n+1} to x{n} < x_{n+1}
msteinbeck
commented
8 years ago How do I know what x-value in the input data some x' in [0,1] corresponds to?
It's the same question as finding the y value for any x value. Use the bisection method until you find t such that net.result[0] is equal enough to the given x value.
mavavilj
commented
8 years ago If I want all points then is there a way to iterate "over t"?
msteinbeck
commented
8 years ago If I want all points then is there a way to iterate "over t"?
Returning all points of a continuous function is very hard to achieve because the function has an infinite number of points :). You are free to iterate over t in discrete steps like:
for (float t = 0.f; t <= 1.f; t += 0.01) // use a discretization of 0.01, adjust to your needs
{/* evaluate spline at t */}
You will find an example iterating over t in nurbs.c
Note: TinySpline uses the name u instead of t because when I started to learn things about splines I read: http://www.cs.mtu.edu/~shene/COURSES/cs3621/NOTES/spline/B-spline/bspline-curve.html.
msteinbeck
commented
8 years ago @Mviljamaa I've just pushed a lot of commits, one of them fixing interpolation for points in 2D.
mavavilj
commented
8 years ago So, you want to interpolate a set/list of points where each x value maps to exactly one y value representing a function and afterwards you want to evaluate the spline s at any x, right?
In order to create such a function your points arranged as [x0, y0, x1, y1, x2, y2, ..., x_n, yn] needs to be strictly monotonically increasing, such that for each value x{n} and x{n+1} the following equation applies: x{n} < x{n+1}.
This is confusing. How am I going to reinterpret the order, if I need to pass the points in an ordered way?
What I'm trying to do is merely is something like be able to draw this kind of graphs, given some points (such as the red dots) to interpolate between: http://profmsaeed.org/wp-content/uploads/2011/03/CubicSpline_01.png
To do that I need a way to return all [x,y]s that such graph consists of. Or all that are required for drawing in sufficient precision.
See how this Spline library does it, very simple: http://kluge.in-chemnitz.de/opensource/spline/
One merely calls s(x) with x: printf("spline at %f is %f\n", x, s(x));
msteinbeck
commented
8 years ago What I'm trying to do is merely is something like be able to draw this kind of graphs, given some points (such as the red dots) to interpolate between
To draw the graph you only need to evaluate the graph at every (discrete) t/u like:
tsBSpline spline;
ts_bspline_interpolate(points /*the points to interpolate*/, num_points, 2 /* 2D */, &spline);
// error handling if you want/need to

// draw the graph
tsDeBoorNet net;
for (float u = 0.f; u <= 1.f; u += 0.01) /* increase/decrease u */
{
  ts_bspline_evaluate(&spline, u, &net);
  // error handling if you want/need to

  // call some sort of draw method, net.result[0] is `x` and net.result[1] is `y`

  // prevent memory leeks
  ts_deboornet_free(&net);
}
Thats it!
To do that I need a way to return all [x,y]s that such graph consists of. Or all that are required for drawing in sufficient precision.
Increase u in lower steps to get higher precision.
If your graphics library (I don't know what you are using) provides methods to draw cubic Bézier curves (usually they do) drawing interpolated splines is very easy. Actually an interpolated spline is a set of piecewise connected Bézier curves. The only thing you need to do is to pass the control point of each Bézier curve to the drawing function:
tsBSpline spline;
ts_bspline_interpolate(points /*the points to interpolate*/, num_points, 2 /* 2D */, &spline);

for (int i = 0; i < n-1 /* the total number of Bézier curves */, i++) // i is the i'th Bézier curve of the spline
{
  draw_bezier_curve( // the name of the function your graphics library provides to draw Bézier curves
    spline.ctrlp[i*4], // the first control point of the i'th Bézier curve
    spline.ctrlp[i*4 + 1], // the second control point of the i'th Bézier curve
    spline.ctrlp[i*4 + 2], // the third control point of the i'th Bézier curve
    spline.ctrlp[i*4 + 3], // the forth control point of the i'th Bézier curve
  );
}
Note: You don't need to check the number of control points returned by ts_bspline_interpolate because (according to the documentation) the number of control points will always be (n-1)*4.
See how this Spline library does it, very simple
Did you see the TODO: "sort input vector, implement an efficient algorithm to evaluate spline(X) where X is a vector, ..."?
Though this is very nice library, it always requires a sorted (strictly monotonically increasing) input in x (TinySpline does not). As already mentioned, this is an important property in order to ensure that each x value maps to exactly one y value. Have a look at http://kluge.in-chemnitz.de/opensource/spline/spline.h line 292-295 and the evaluating function double spline::operator() (double x) const beginning at line 375 which uses std::lower_bound (The documentation of this function says: "The elements in the range shall already be sorted according to this same criterion (operator< or comp), or at least partitioned with respect to val.")
The drawback of this library is, that it is 'only' able to interpolate function like cubic splines while TinySpline is able to interpolate any kind of cubic spline, for instance, splines like: http://www.math.ucla.edu/~baker/149.1.02w/handouts/dd_splines.pdf page 11 (DD 11)
If you want to, I can add the bisection method to the interface of TinySpline in order to enhance the usability in case of x to y mapping.
mavavilj
commented
8 years ago ts_bspline_interpolate(points /the points to interpolate/, num_points, 2 /* 2D */, &spline);
Since points is a const float *, then how are the 2D points arranged in it? In pairs of two?
msteinbeck
commented
8 years ago Let's say x_{i} is the i'th x value and y_{i} the i'th y value of the spline to interpolate, for instance, x_{0}, y_{0} is the first point, x_{1}, y_{1} is the second point and so on. The function ts_bspline_interpolate expects the parameter points to be structured as follows: [x_{0}, y_{0}, x{1}, y_{1}, ... x_{n-1}, y_{n-1}].
So, let's say you have some points (1, 2), (4, 7), (8, -5) and (16, -25) where x_{0} = 1, y_{0} = 2, x_{1} = 4, y_{1} = 7 ... then points must be [1, 2, 4, 7, 8, -5, 16, -25].
Note: All arrays of TinySpline are structured this way with respect the the spline's dimension (actually the dimension of each points). If you, for instance, use points in 3D then points looks like: [x_{0}, y_{0}, z_{0}, x_{1}, y_{1}, z_{1}, ..., x_{n-1}, y_{n-1}, z_{n-1}].
mavavilj
commented
8 years ago ts_bspline_interpolate and ts_bspline_evaluate seem to be only in the C version. The CPP version looks different. Do the CPP files work or why are you giving examples in the C style?
msteinbeck
commented
8 years ago Do the CPP files work
Yes, they are fully working ( except of bugs I don't know about yet :D ).
or why are you giving examples in the C style?
I didn't had the time yet to provide examples for every language but in the future I will. Thanks to @mkv123 so far for providing short examples for Python which I will add to the project some day :).
ts_bspline_interpolate and ts_bspline_evaluate seem to be only in the C version.
The function ts_bspline_interpolate is wrapped by this constructor. Instead of a float* you have to use a std::vector. The second parameter n is not required because a std::vector provides the method size returning the number of values contained in a std::vector. Due to the nature of constructors returning an object (in this case an object of type TsBSpline, the wrapper class of the struct tsBSpline) the output parameter bspline is not required as well.
The function ts_bspline_evaluate is wrapped by this method. Instead of using the out parameter deBoorNet it returns an instance of TsDeBoorNet, the wrapper class for the struct tsDeBoorNet. The operator TsDeBoorNet operator()(const float u) const is just a convenience method for TsDeBoorNet evaluate(const float u) const (similar to http://kluge.in-chemnitz.de/opensource/spline/).
Note: The error handling of the C interface has been wrapped to exceptions (std::runtime_error).
mavavilj
commented
8 years ago Where's the result (x,y) in the tinysplinecpp.h? And how is it structured?
msteinbeck
commented
8 years ago TsDeBoorNet::result() returns the vector containing the result of an evaluation, for instance:
TsBSpline b(points, 2); // create a spline (2D) interpolating the given points
std::vector vec = b(0.5f).result(); // evaluate b at t=0.5f and store result in 'vec'
vec[0] // the x value at t=0.5f
vec[1] // the y value at t=0.5fLets just check.
Does this library produce the missing values if I give the TsBSpline constructor e.g. 1024 points (so since it's in 2D then the vector length is 2048) so that it contains y=0 for all other points but, say, three points. I'd expect the library then generate the missing "envelopes" from 0 to the first y≠0 value and then from this to the second y≠0 value and then from this to the third y≠0 value and finally from this back to y=0?
msteinbeck
commented
8 years ago Does this library produce the missing values if I give the TsBSpline constructor e.g. 1024 points (so since it's in 2D then the vector length is 2048)
TinySpline provides a function (namely ts_bspline_interpolate or rather this constructor) to create a spline interpolating a given list of points. Interpolation means the resulting spline 'goes through' the given points in a smooth way. You can evaluate the resulting spline at any t with 0 <= t <= 1. By concept some of the t values will result in exactly points you have used to interpolate the spline (otherwise the interpolated spline would not go through your points).
so that it contains y=0 for all other points but, say, three points. I'd expect the library then generate the missing "envelopes" from 0 to the first y≠0 value and then from this to the second y≠0 value and then from this to the third y≠0 value and finally from this back to y=0?
The library does not explicitly generate these points. You have to generate them by iterating over t (from 0 to 1 in small, discrete steps). So yes, TinySpline should fulfill your requirements.
mavavilj
commented
8 years ago So do I need to give it some other points than zeroes and few non-zero values? Or merely pass points in small steps to have the library generate points in place of the zeroes?
E.g. could I give it linear interpolated "three point envelope" and it would change to follow e.g. spline interpolation?
msteinbeck
commented
8 years ago So do I need to give it some other points than zeroes and few non-zero values? Or merely pass points in small steps to have the library generate points in place of the zeroes?
Sorry but I don't understand. Maybe you could add a simple example showing the points you want to interpolate.
mavavilj
commented
8 years ago Here's precisely what I currently have:
int s = 0;
    int maks = 256;

    for(int n=0; n<num_points; ++n) {
        float r = LO + static_cast <float> (rand()) /( static_cast <float> (RAND_MAX/(HI-LO)));

        for(s; s<maks-1; s++) {
            envelope.push_back(s);
            envelope.push_back(0.0);
        }
        envelope.push_back(maks-1);
        envelope.push_back(r);
        s += 1;

        maks = s+256;
    }

    for(s; s<maks; s++) {
        envelope.push_back(s);
        envelope.push_back(0.0);
    }
So what it does is:
Specifies how many "control points" in num_points. Fills a vector so that every num_point is 256 x-points apart from each other, the "betweens" are filled with (0,0)s: -255 (0,0)s before the first control point -255 (0,0)s between the first and second control point and so on.
So since there are now three non-(0,0) points in the vector, then can your library generate points that connect (0,0)s to the non-(0,0)s so that the vector contains an envelope passing through those three points?
Essentially I'm trying to create this kind of envelope, where the control point locations are known, but the "envelopes" connecting them are "simulated": https://www.image-line.com/support/FLHelp/html/img_plug/Harmor_env.jpg
msteinbeck
commented
8 years ago I'm sorry but I'm not completely sure what you are trying to do :D. Nonetheless, interpolating a single spline as shown at https://www.image-line.com/support/FLHelp/html/img_plug/Harmor_env.jpg is not possible. The (cubic) spline interpolation creates a spline that is C^2 continuous at every point (at every t to be more precise). That is, the interpolated spline is 'curvy' at every point The spline shown at your figure is c^0 continuous (maybe even discontinuous) at some points, for instance the point annotated with 'Point (right-click for menu)'. That is, the spline is 'edged' at these points. Actually, you can express such a spline with a single B-Spline by inserting knots and, thus, decreasing the continuity of the spline at the desired points but I would suggest to interpolate a set of splines. So, let's say you want to create the spline shown at your figure. Then, you could interpolate the first three points, afterwards the next three points (where the last point of the first spline is the first point of the second spline) and so on. The last spline (the one moving on x = 0 to the first point of the first spline) is interpolated by only two points resulting in a (simple) line.
Note: You don't have to interpolate the suggested line, if your spline must not be a closed shape.
mavavilj
commented
8 years ago It seems like when passing the above described vector (it has three (x,y), y≠0 points and other points (x,0)) to tsBSpline, then net.result seems to return only points of the form (x,0). So it seems like it doesn't generate the points "between" the zero (x,0)s in the vector and (three) non-zero (x,y)s.
So I'm still a bit confused about what kind of point set should I pass to tsBSpline.
Also even if my domain was, say, x in [0,200], then do I need to scale this to the range [0,1](i.e. map [0,200] to [0,1]) where tsBSpline seems to operate?(*)
I would like to control "how many points I get out". E.g. a power of two number of points.
The above (*) seems like, no I don't have to scale the domain to [0,1], tinyspline does it.
However, can I control it so that if I e.g. give it the domain (of x) [0,127], then I could get back exactly 128 (x,y) points?
mavavilj
commented
8 years ago Can you use tinyspline in a "generative" way?
What I mean is, can one call tinyspline with just one or two or few time units (e.g. two samples per call) and a "hop size" and have it "generate" the curve as new samples are passed to it? Rather than pass it all the num_points for a longer time period (e.g. 1024 samples) at the same time?
msteinbeck
commented
8 years ago You can use the resize function to increase the number of control points step by step. Afterwards you have to assign the added control points to the desired coordinates. Note: This function does not interpolate the added control points and may invalidate the knot vector (you have to use this fucntion to make the knot vector valid). If you want to generate an interpolated spline stepwise, you have to use the interpolation function with all control points of the last step plus the new control points and, thus, create a new spline for each step.
 bill-chadwick
commented
8 years ago
bill-chadwick
commented
8 years ago I want to find a set of Beziers that I can used to represent the smoothed outline of a polygon. I have say a dozen 2D points representing my polygon and want to get eleven Bezier segments to submit to a graphics drawing primitive.
Some tips on how to use tinyspline to achieve that would be great.
msteinbeck
commented
8 years ago Which interface are you using C, C++, Python, ... ?
bill-chadwick
commented
8 years ago An example in C would be good.
I am actually working on Android and Windows. Ideally I want to replicate Windows GDI's DrawCurvedPath (which has a selectable tension) on Android. My polygon is a closed Convex Hull.
Hope that helps. On 22 Apr 2016 12:45, "Marcel" notifications@github.com wrote:
Which interface are you using C, C++, Python, ... ?
— You are receiving this because you commented. Reply to this email directly or view it on GitHub https://github.com/retuxx/tinyspline/issues/6#issuecomment-213390470
bill-chadwick
commented
8 years ago Should have written drawclosedcurve
bill-chadwick
commented
8 years ago I want the knots to lie on the spline and need the pairs of Bezier control points between each knot.
msteinbeck
commented
8 years ago Ok, maybe I can help you. I will write a short example later this day.
bill-chadwick
commented
8 years ago That would be very kind.
On Fri, Apr 22, 2016 at 3:17 PM, Marcel notifications@github.com wrote:
Ok, maybe I can help you. I will write a short example later this day.
— You are receiving this because you commented. Reply to this email directly or view it on GitHub https://github.com/retuxx/tinyspline/issues/6#issuecomment-213445343
msteinbeck
commented
8 years ago Hi @bill-chadwick, I had some time to think about your request and I have to say that I'm a bit confused. Actually, a sequence of lines connecting the points of your polygon already is the best fitting sequence of Bezier curves because every line is a Bezier curve (all control points of a Bezier curve are collinear and, thus, form a line). Why do you need to use a sequence of Bezier curves? Does the sequence need to have a specific degree (a sequence of cubic spline for example)? Do you have an example image of the result you need?
msteinbeck
commented
8 years ago Maybe the cubic spline interpolation is what you are looking for. It creates a smooth line connecting each successive point of your polygon. On the other hand, connecting the points with a smooth spline may lead to bad approximations.
bill-chadwick
commented
8 years ago A smoothed curve around my polygon points is what I want. It will be used to indicate the approximate area of a small group of things on a map. Such a grouping looks much nicer as a smooth curve than a straight sided polygon, especially when several such groupings are shown at the same time.
So my closed polygon vertices are knots and I want pairs of bezier spline control points between each knot.
I Hope that explanation is clearer.
Thanks again.
Bill On 22 Apr 2016 22:02, "Marcel" notifications@github.com wrote:
Maybe the cubic spline interpolation is what you are looking for. It creates smooth line connecting each successive point of your polygon. On the other hand, connecting the points with a smooth line may lead to bad approximations.
— You are receiving this because you were mentioned. Reply to this email directly or view it on GitHub https://github.com/retuxx/tinyspline/issues/6#issuecomment-213587846
msteinbeck
commented
8 years ago After hours of reading math about splines and interpolation, I finally got what you are looking for. What you need is a periodic spline interpolatoin. This kind of interpolation ensures that the first and second derivative of the first and last control points are equal. Currently, TinySpline supports variational spline interpolation only (I'm not sure if this is the correct name but MathWorks uses it and it sounds OK to me). Unlike the periodic interpolation, the variational interpolation does not create a spline with this property. Actually, it creates a spline where the second derivate of the endpoints are zero. Thus, connecting the last control point with the first one does not fit your needs. However, I think I know how to implement this feature. If you give me some time (should be finished within some days) I will add it and give a short example.
bill-chadwick
commented
8 years ago Thanks very much Marcel. Handling closed paths will be a good addition to TS. On 23 Apr 2016 13:27, "Marcel" notifications@github.com wrote:
After hours of reading math about splines and interpolation, I finally got what you are looking for. What you need is a periodic spline interpolatoin. This kind of interpolation ensures that the first and second derivative of the first and last control points are equal. Currently, TinySpline supports variational spline interpolation only (I'm not sure if this is the correct name but MathWorks http://de.mathworks.com/help/curvefit/csape.html uses it and it sounds OK to me). Unlike the periodic interpolation, the variational interpolation does not create a spline with this property. Actually, it creates a spline where the second derivate of the endpoints are zero. Thus, connecting the last control point with the first one does not fit your needs. However, I think I know how to implement this feature. If you give me some time (should be finished within some days) I will add it and give a short example.
— You are receiving this because you were mentioned. Reply to this email directly or view it on GitHub https://github.com/retuxx/tinyspline/issues/6#issuecomment-213732447
msteinbeck
commented
8 years ago Hey @bill-chadwick. I'm sorry for the missing progress of the requested feature. I'm currently in a rush and have not much time to add features for TinySpline. Nonetheless, I'm looking forward to accomplish the task. I will create a new issue for your request since this is not the right place.
bill-chadwick
commented
8 years ago Marcel,
No worries.
I found a solution on codeproject.
http://www.codeproject.com/Articles/33776/Draw-Closed-Smooth-Curve-with-Bezier-Spline
Bill
On Thu, May 19, 2016 at 9:50 AM, Marcel notifications@github.com wrote:
Hey @bill-chadwick https://github.com/bill-chadwick. I'm sorry for the missing progress of the requested feature. I'm currently in a rush and have not much time to add features for TinySpline. Nonetheless, I'm looking forward to accomplish the task. I will create a new issue for your request since this is not the right place.
— You are receiving this because you were mentioned. Reply to this email directly or view it on GitHub https://github.com/retuxx/tinyspline/issues/6#issuecomment-220264766
 resema
commented
8 years ago
resema
commented
8 years ago Hi Marcel
I'm looking at your very interesting library. I have a similar case as described by mviljamaa. I'm getting the points and everything. But what I don't understand is the result vector. The description says, that it contains a pointer to the last point in points. I want to get the resulting spline at any t with 0 <= t <= 1, but what are the ranges?
For example, if I have a vector with 4 points, is t=0 at the very beginning and t=1 at the end of all 4 points? Or is it between two points? If so, how do I jump to the next segment? To iterate in a certain step size from p0 to p3, do I have to use the result or the points vector?
Thanks a lot in advance, Renato
msteinbeck
commented
8 years ago Hi Renato,
But what I don't understand is the result vector. The description says, that it contains a pointer to the last point in points.
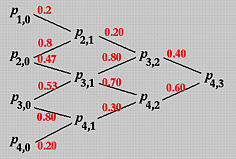
It's very simple once you got the concept of De Boor's algorithm. Let's have a look at this figure. As you can see, you have to calculate the points P_{1,0}, P_{2,0}, ..., P_{2,1}, P_{3,1}, ..., P_{3, 2}, ... to eventually get the point P_{4,3}, which is the result of a spline evaluation at t within the spline's domain---usually 0 <= t <= 1. Have a look at this tutorial to read more about the algorithm.
Now, the struct tsDeBoorNet stores all points (from P_{1,0} to P_{4,3}) in points. However, usually you want to access the result of an evaluation rather than all points that were necessary to calculate the deboor net. Thus, the field result points to the last point in points which, in our scenario, is P_{4,3}.
I want to get the resulting spline at any t with 0 <= t <= 1, but what are the ranges?
Actually, this depends on the knot vector of your spline. In case of clamped splines, knots[0] is the very beginning of your spline and knots[n_knots-1] is the end of your spline. Nonetheless, in case of opened splines, knots[0] and knots[n_knots-1] are outside the spline's domain. Have a look at this introduction to read more about clamped and opened splines.
If you have further questions, feel free to ask :).
resema
commented
8 years ago Hi Marcel
Thanks a lot for the quick answer. I really appreciate it!
If I understand the theory right and find the correct words, this means that if I want all points bilding the generated curve from the 4 control points P_0 to P_3, I have to call the method evalute multiple times with different t. The resulting point is stored in the resultvector.
And yes, my demo program shows this kind of behavior!!!! =)
Thanks a lot!
resema
commented
8 years ago This is how it looks like now

msteinbeck
commented
8 years ago If I understand the theory right and find the correct words, this means that if I want all points bilding the generated curve from the 4 control points P_0 to P_3, I have to call the method evalute multiple times with different t. The resulting point is stored in the result vector.
You got it :). By the way, if you would draw all points in points you would see some something like this. The green dots are the points from the first column of the deboor net, the blue dots are the points from the second column and the black dot is the resulting point of the evaluation.
Thanks a lot!
You are welcome.
msteinbeck
commented
8 years ago Closing this issue as it became something like a discussion forum.
Currently the interface of TinySpline is not very well documented. I really need to fix this.