 ladyada
commented
6 years ago
ladyada
commented
6 years ago some noodling
#!/usr/bin/python3
# -*- coding: utf-8 -*-
import random
from collections import deque
from itertools import islice
from PyQt5.QtCore import QPointF, QTimer
from PyQt5.QtChart import QChart, QLineSeries, QChartView, QValueAxis
from PyQt5.QtWidgets import QWidget, QApplication, QGridLayout, QPushButton
from PyQt5.QtGui import QPainter

class PressureGraph(QWidget):
    def __init__(self):
        super().__init__()
        self.t = range(0,150)
        self.q = deque([0]*len(self.t))
        self.initUI()

    def on_resize(self, event):
        #print(event.size())
        x = event.size().width() // 2
        y = event.size().height()
        self.chart.axisY().setMax(y)
        self.chart.axisX().setMax(x)
        self.t = range(0, x)
        q_len = len(self.q)
        if x > q_len: # extend it!
            self.q.extendleft([0] * (x - q_len))
        if x < q_len: # contract it
            self.q = deque(islice(self.q, q_len-x, q_len))
        #print(self.q)
        self.chartView.update()

    def initUI(self):
        self.series = QLineSeries()

        self.chart = QChart()
        self.chart.legend().hide()
        self.chart.addSeries(self.series)

        self.axis_x = QValueAxis()
        self.axis_y = QValueAxis()
        self.axis_x.setRange(0, 150)
        self.axis_y.setRange(0, 200)
        self.axis_x.setLabelFormat("")
        self.axis_y.setLabelFormat("%d")
        self.chart.setAxisX(self.axis_x, self.series)
        self.chart.setAxisY(self.axis_y, self.series)

        self.chartView = QChartView(self.chart)
        self.chartView.setRenderHint(QPainter.Antialiasing)

        self.grid = QGridLayout()
        self.grid.addWidget(self.chartView)

        self.setLayout(self.grid)

        self.resize(1000,500)
        self.resizeEvent = lambda e: self.on_resize(e)

    def update(self, newpoint):
        self.q.append(newpoint)
        if len(self.q) > len(self.t):
            self.q.popleft()

        p_list = []
        for i in range(0, len(self.t)):

            if i > (len(self.q) - 1):
                temp = 0
            else:
                temp = self.q[len(self.t) - 1 - i]
            p_list.append((self.t[i], temp))

        self.series.clear()
        for i in p_list:
            self.series.append(*i)

        self.chartView.update()

if __name__ == "__main__":
    import sys

    global graph

    app = QApplication([sys.argv])
    graph = PressureGraph()
    graph.show()

    timer = QTimer()
    timer.timeout.connect(lambda: graph.update(random.randrange(0,180)))
    timer.start(500) # in millis

    sys.exit(app.exec_())
ntoll
ntoll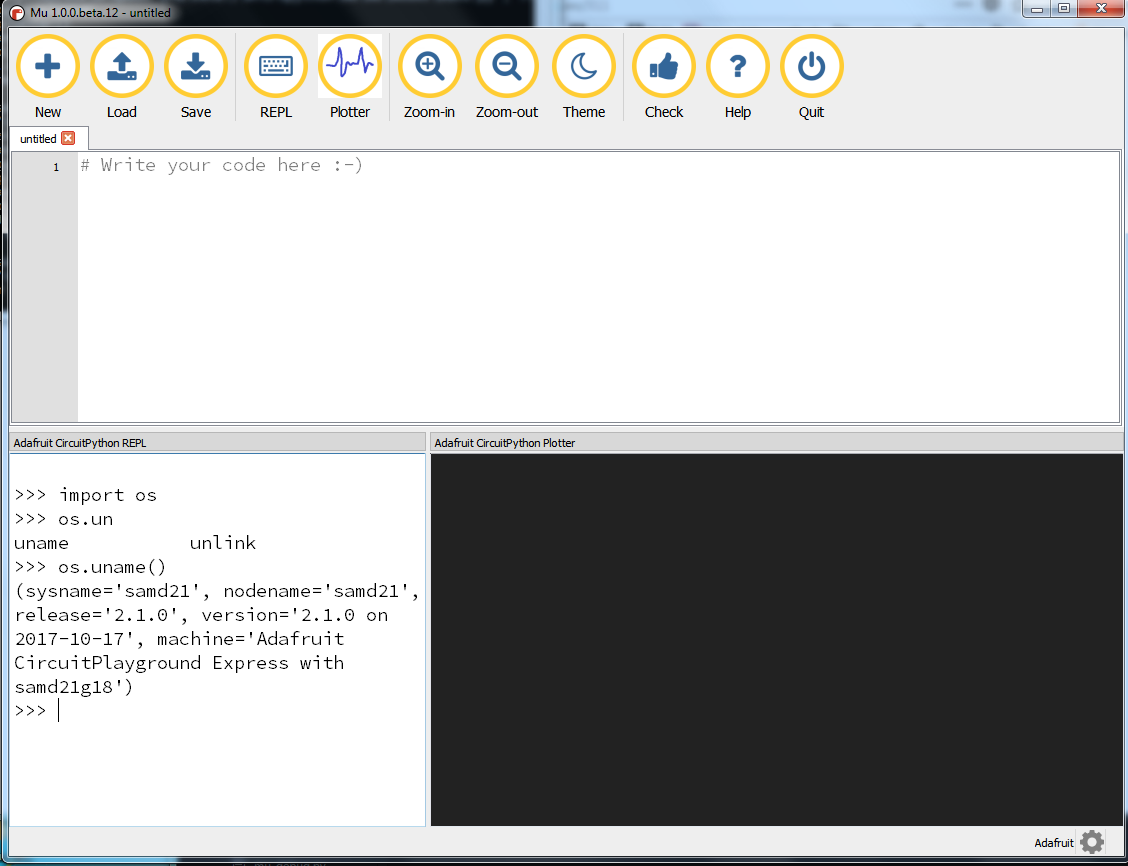

 yonghuming
 bennuttall
 carlosperate
 CedarGroveStudios
ok im going to start hacking on adding a plotter current plan is to use QtCharts which will handle the drawing. ideally it will look for CSV-like data coming in off the repl. ideal would be if we could have REPL and plotter going at the same time. will see how it goes :)