 mykytyn
commented
10 years ago
mykytyn
commented
10 years ago For 3, how do you want the samples and lnprobs saved? Like we've being doing in a triangle plot?
Open davidwhogg opened 10 years ago
mykytyn
commented
10 years ago For 3, how do you want the samples and lnprobs saved? Like we've being doing in a triangle plot?
mykytyn
commented
10 years ago Also what do you mean by 32x32 independent samples? I get that we have 32 walkers, and therefore 32 positions at the end of the run, but why is it 32x32? Also when you say continue from the last saved state to double the number of walkers, do you mean, now run for 256 with 64 walkers?
mykytyn
commented
10 years ago For 3 again, are you sure you mean nsteps > 32*max(acor)? Because I'm trying to rerun repeatedly, and I keep getting higher and higher acorr values, not the opposite.
 davidwhogg
commented
10 years ago
davidwhogg
commented
10 years ago If acor is getting longer as the run is getting longer then I don't understand. @dfm does acor return autocorrelation times or the number of independent samples per walker.
And above I meant run until you have doubled the number of Steps not the number of Walkers. Sorry.
 dfm
commented
10 years ago
dfm
commented
10 years ago This is a common problem with acor. We are estimating the integrated acor time from the samples themselves and until that number converges, it's likely to be an underestimate! If you run for long enough, you should get an acor time that stays roughly constant as you take more steps but it can take a long time to reach that.
dfm
commented
10 years ago Also, the master branch of emcee includes a (slightly) more robust algorithm that uses FFT to compute the autocorrelation function. It's still susceptible to the same problems though.
davidwhogg
commented
10 years ago okay @mykytyn then run for longer and plot max(acor) as a function of run length (number of steps)
mykytyn
commented
10 years ago ok I tried to do this, but made a slight typo, re-running now, but for informational purposes it took about 17,000 steps for numsteps > 32*np.max(acor) to be true. The resulting (huge) triangle plot looked like this btw: http://broiler.astrometry.net/~dwm261/Quasars/587730845813048270/newest_test-triangle.png
mykytyn
commented
10 years ago This is the graph of num_steps vs. max(acor)*32 http://broiler.astrometry.net/~dwm261/Quasars/acor.png
davidwhogg
commented
10 years ago that makes no-ish sense.
Can you plot all N acor values as a function of N_steps, and label both axes?
mykytyn
commented
10 years ago i've been trying to do this for ~8 hours (>25000 steps) and it still hasn't reached a state where the # of steps is greater than 32*max(acor), once it does reach that state (if ever?) I'll have those plots tho.
davidwhogg
commented
10 years ago Don't wait to reach that state; sorry if I implied that. Make the plots now.
davidwhogg
commented
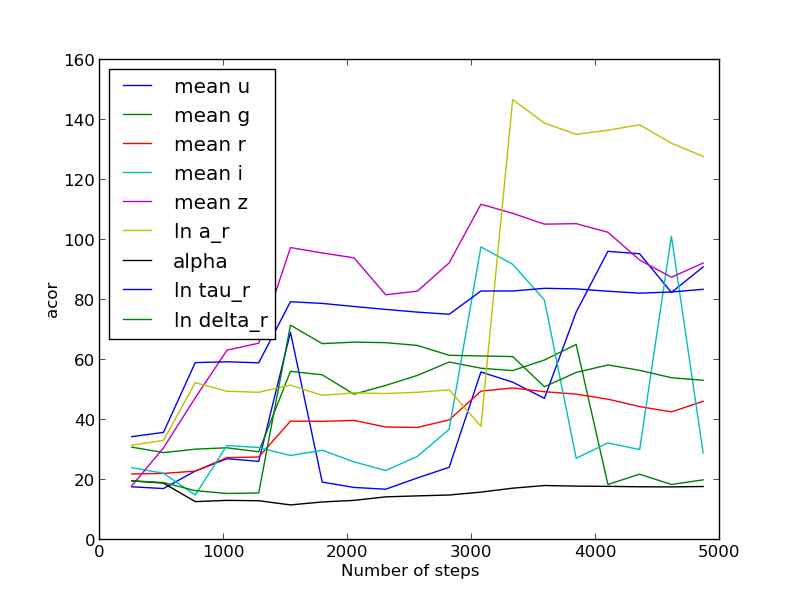
10 years ago ps. Label the lines with the parameter names. I think something is going badly wrong.
mykytyn
commented
10 years ago I got this: http://broiler.astrometry.net/~dwm261/Quasars/acor.png Seems like there are weird spikes in the acor values?
davidwhogg
commented
10 years ago I thought you went for 25000 steps; can you make the plots all the way out?
Not obviously concerning yet...
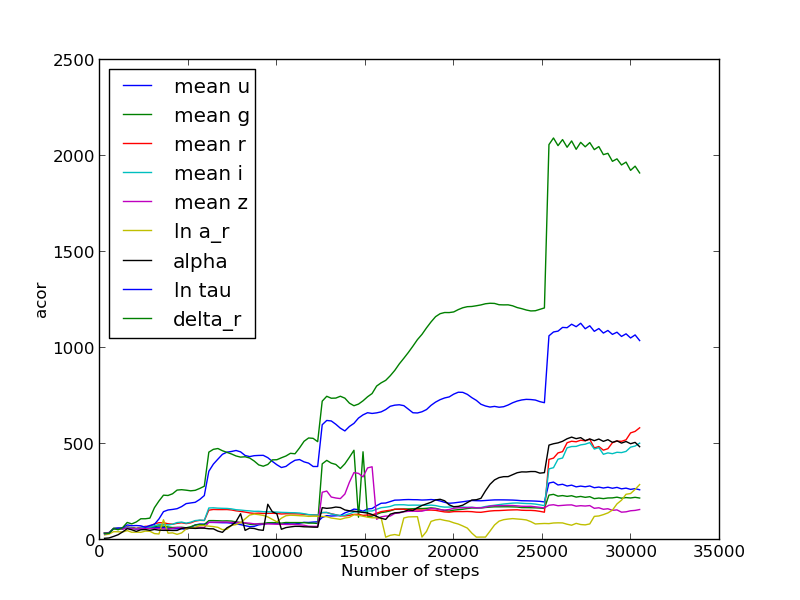
mykytyn
commented
10 years ago http://broiler.astrometry.net/~dwm261/Quasars/acor2.png This is a longer plot.
davidwhogg
commented
10 years ago did you remove that bad point / outlier? If not, that might be causing the problem.
Can you remove the bad points (as called for in another issue) and rerun?
mykytyn
commented
10 years ago http://broiler.astrometry.net/~dwm261/Quasars/587730845813965270/bad_data_test-acor.png
This is the acor plot with the bad data removed. (Note that the y-axis is much much smaller than the previous plot) So it seems like this is okay now?
mykytyn
commented
10 years ago I mean y-axis scaling of course
davidwhogg
commented
10 years ago Yes, this is good. But let's make stopping criterion 64 x median acor.
davidwhogg
commented
10 years ago median, not max
mykytyn
commented
10 years ago Where are you getting 64 from. Is it a random number or is it 2*num_walkers(currently 32), or something else? Just want to make sure my code is agnostic to num_walkers...
davidwhogg
commented
10 years ago Just made it up. Agreed that you shouldn't key it to num_walkers
mykytyn
commented
10 years ago ok this is now in the code.
Here's how I want the sampler to "decide" how long to go.
Let me know if you have questions. This way we always get 32 x 32 independent samples at least.