Thanks a lot for reporting & fixing this issue. Got merged and will be released with the next version.
Closed AllanDaemon closed 3 years ago
Thanks a lot for reporting & fixing this issue. Got merged and will be released with the next version.
Got released with n8n@0.114.0
Describe the bug The memory of the worker process grows up and never shrinks, usually crashing with with "Out of memory" error. It seems to be due to connections left open by the Redis node.
This is another issue that I found in my load tests (https://community.n8n.io/t/stress-load-testing/4846). I have a workflow with webhook that when I execute it, the worker processes memory grows over time. It never decreases significantly, even after an explicit call to the GC (start worker in node with
--expose-gc, in a webhook run a function item that callsglobal.gc();)Let me tell my references: my computer has 8GB of ram. I usually monitor it using the
htopcommand, looking at theMEM%column, which is the amount of memory usage relative to the total. When I start a worker process, it usually uses 2.5%. When in load execution webhook workflows (like 10 requests per second or more), it may increase the usage up to 5%, but never gets over this. It fluctuates, because of the allocations and the garbage collector(GC). After the requests stop coming, it comes back to the 2.5% baseline. When it has memory leaks, it just keeps increasing, and I usually stop with 18% - 20% of total memory usage to avoid crashing. Even after all requests stop, it keeps the usage this high, even after the forced garbage collection.I tried to use traditional tools for figuring it out, but with no luck: trying to inspect the heap memory with inspector always crashes the node process of the worker (https://github.com/nodejs/node/issues/37878). I was able to get a heap dump when not using the queue process, just one process with
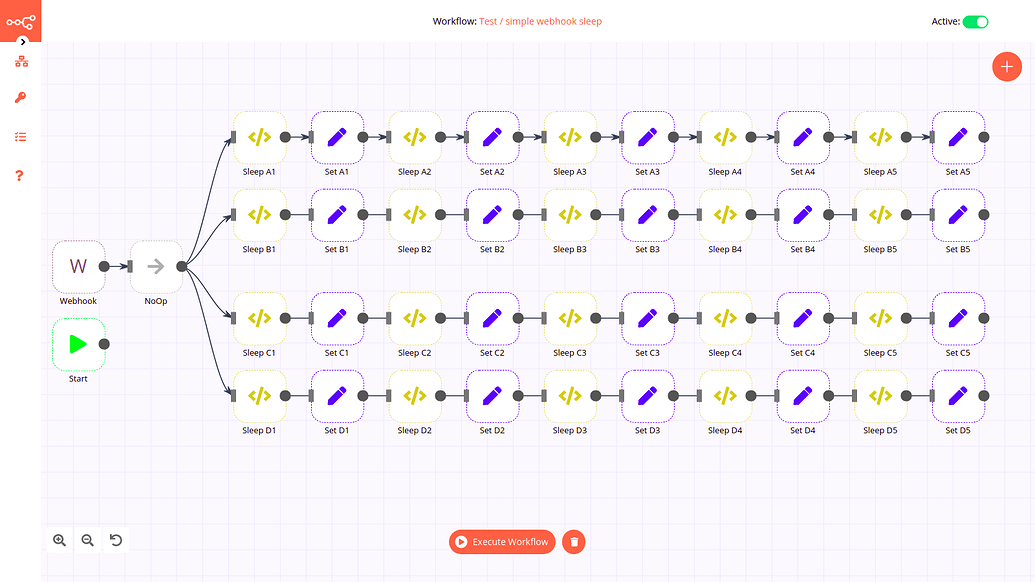
EXECUTIONS_PROCESS=main, taking a dump using the heapdump library just after the process start and after a while of execution, but I couldn't understand or get any insight from that, except it was a lot of allocations in thesystemandclosurescategory.I took a different path and started to strip down the workflow that was able to reproduce it. First, I tested a lot of different simple workflows to check if any of the nodes Webhook, Set or Function Item could cause the issue. The following workflow, with a lot of sets and functions with sleep, kept running for hours and the memory usage was kept normal, so I concluded that they were safe.
The sleep code in the Function Item node is this:
await new Promise(r => setTimeout(r, 500)); return {};. It's asynchronous, so I do not block JS event loop.With that, I started to strip down the offending workflow, replacing nodes with potential to trouble, like the Execute Workflow node, with a sleep node using the same amount of time observed in the wild, so it kept the workflow as similar as possible and creating mock nodes that return an example of data in the place of external calls.
I finally found out that the Redis node is likely to be the problem. I even created a simple workflow where it just set and read from Redis, and quickly I got an error with maximum connections in Redis server. As I mentioned in the community forum, I suspected that I could be something like I did before in a custom node: I created connections to a MongoDB server and expected that at the end of the function they would be closed, but that wasn't the case. When the MongoDB server raised an alarm with the number of maximum connections above 90%, I suspected it could be something like that, and it was confirmed when I close the N8N process and the number dropped from many hundreds to a dozen.
I suspect that something similar could be happening in the RabbitMQ node as well, as I have some issues with it in the long runs that I couldn't reproduce, but now I know where to look.
I also suspect the while the connection is kept open, due to the closures, it keeps referencing other data besides the connections that never get released. This correlates with the memory heap dump observations.
After this issue, I'll try to check the code, find the bug and fix it, so hopefully, the next interaction of mine here will be a reference from a PR.
Sorry if this took long, but I thought it was important to share the details of how I got there instead of just pointing out the results. I hope this can be helpful somehow.
Environment:
DB_TYPE=postgresdbEXECUTIONS_PROCESS=mainEXECUTIONS_MODE=regular