napari / napari

napari: a fast, interactive, multi-dimensional image viewer for python
https://napari.org
BSD 3-Clause "New" or "Revised" License
2.1k stars 410 forks source link

Tracks lines for representing trajectories in nD+t #539

Closed royerloic closed 3 years ago

royerloic commented 4 years ago

🚀 Feature

A typical bioimage analysis task is to track the movement of objects of interest such as cells in their 2D or 3D movement (possibly more, @jni --guardian-of-dimensions-- would argue). Having the possibility to display such tracks both in the 2D and 3D view and show future and past positions (increasingly faint and transparent as you go away from the current time point) would be extremely useful. The possibility to edit such tracks and adjust the positions of objects would be cool too to refine the output of automated algorithms. Dealing with object division can be done by ending a track and restarting two tracks. Basic styling of the thickness, opacity of the tracks, and how far back they extend in the past or future, would be great too.

Tracks could be represented as a collection of n*k arrays where n is the length of the track, and k is the dimension of the space occupied by the objects.

sofroniewn commented 
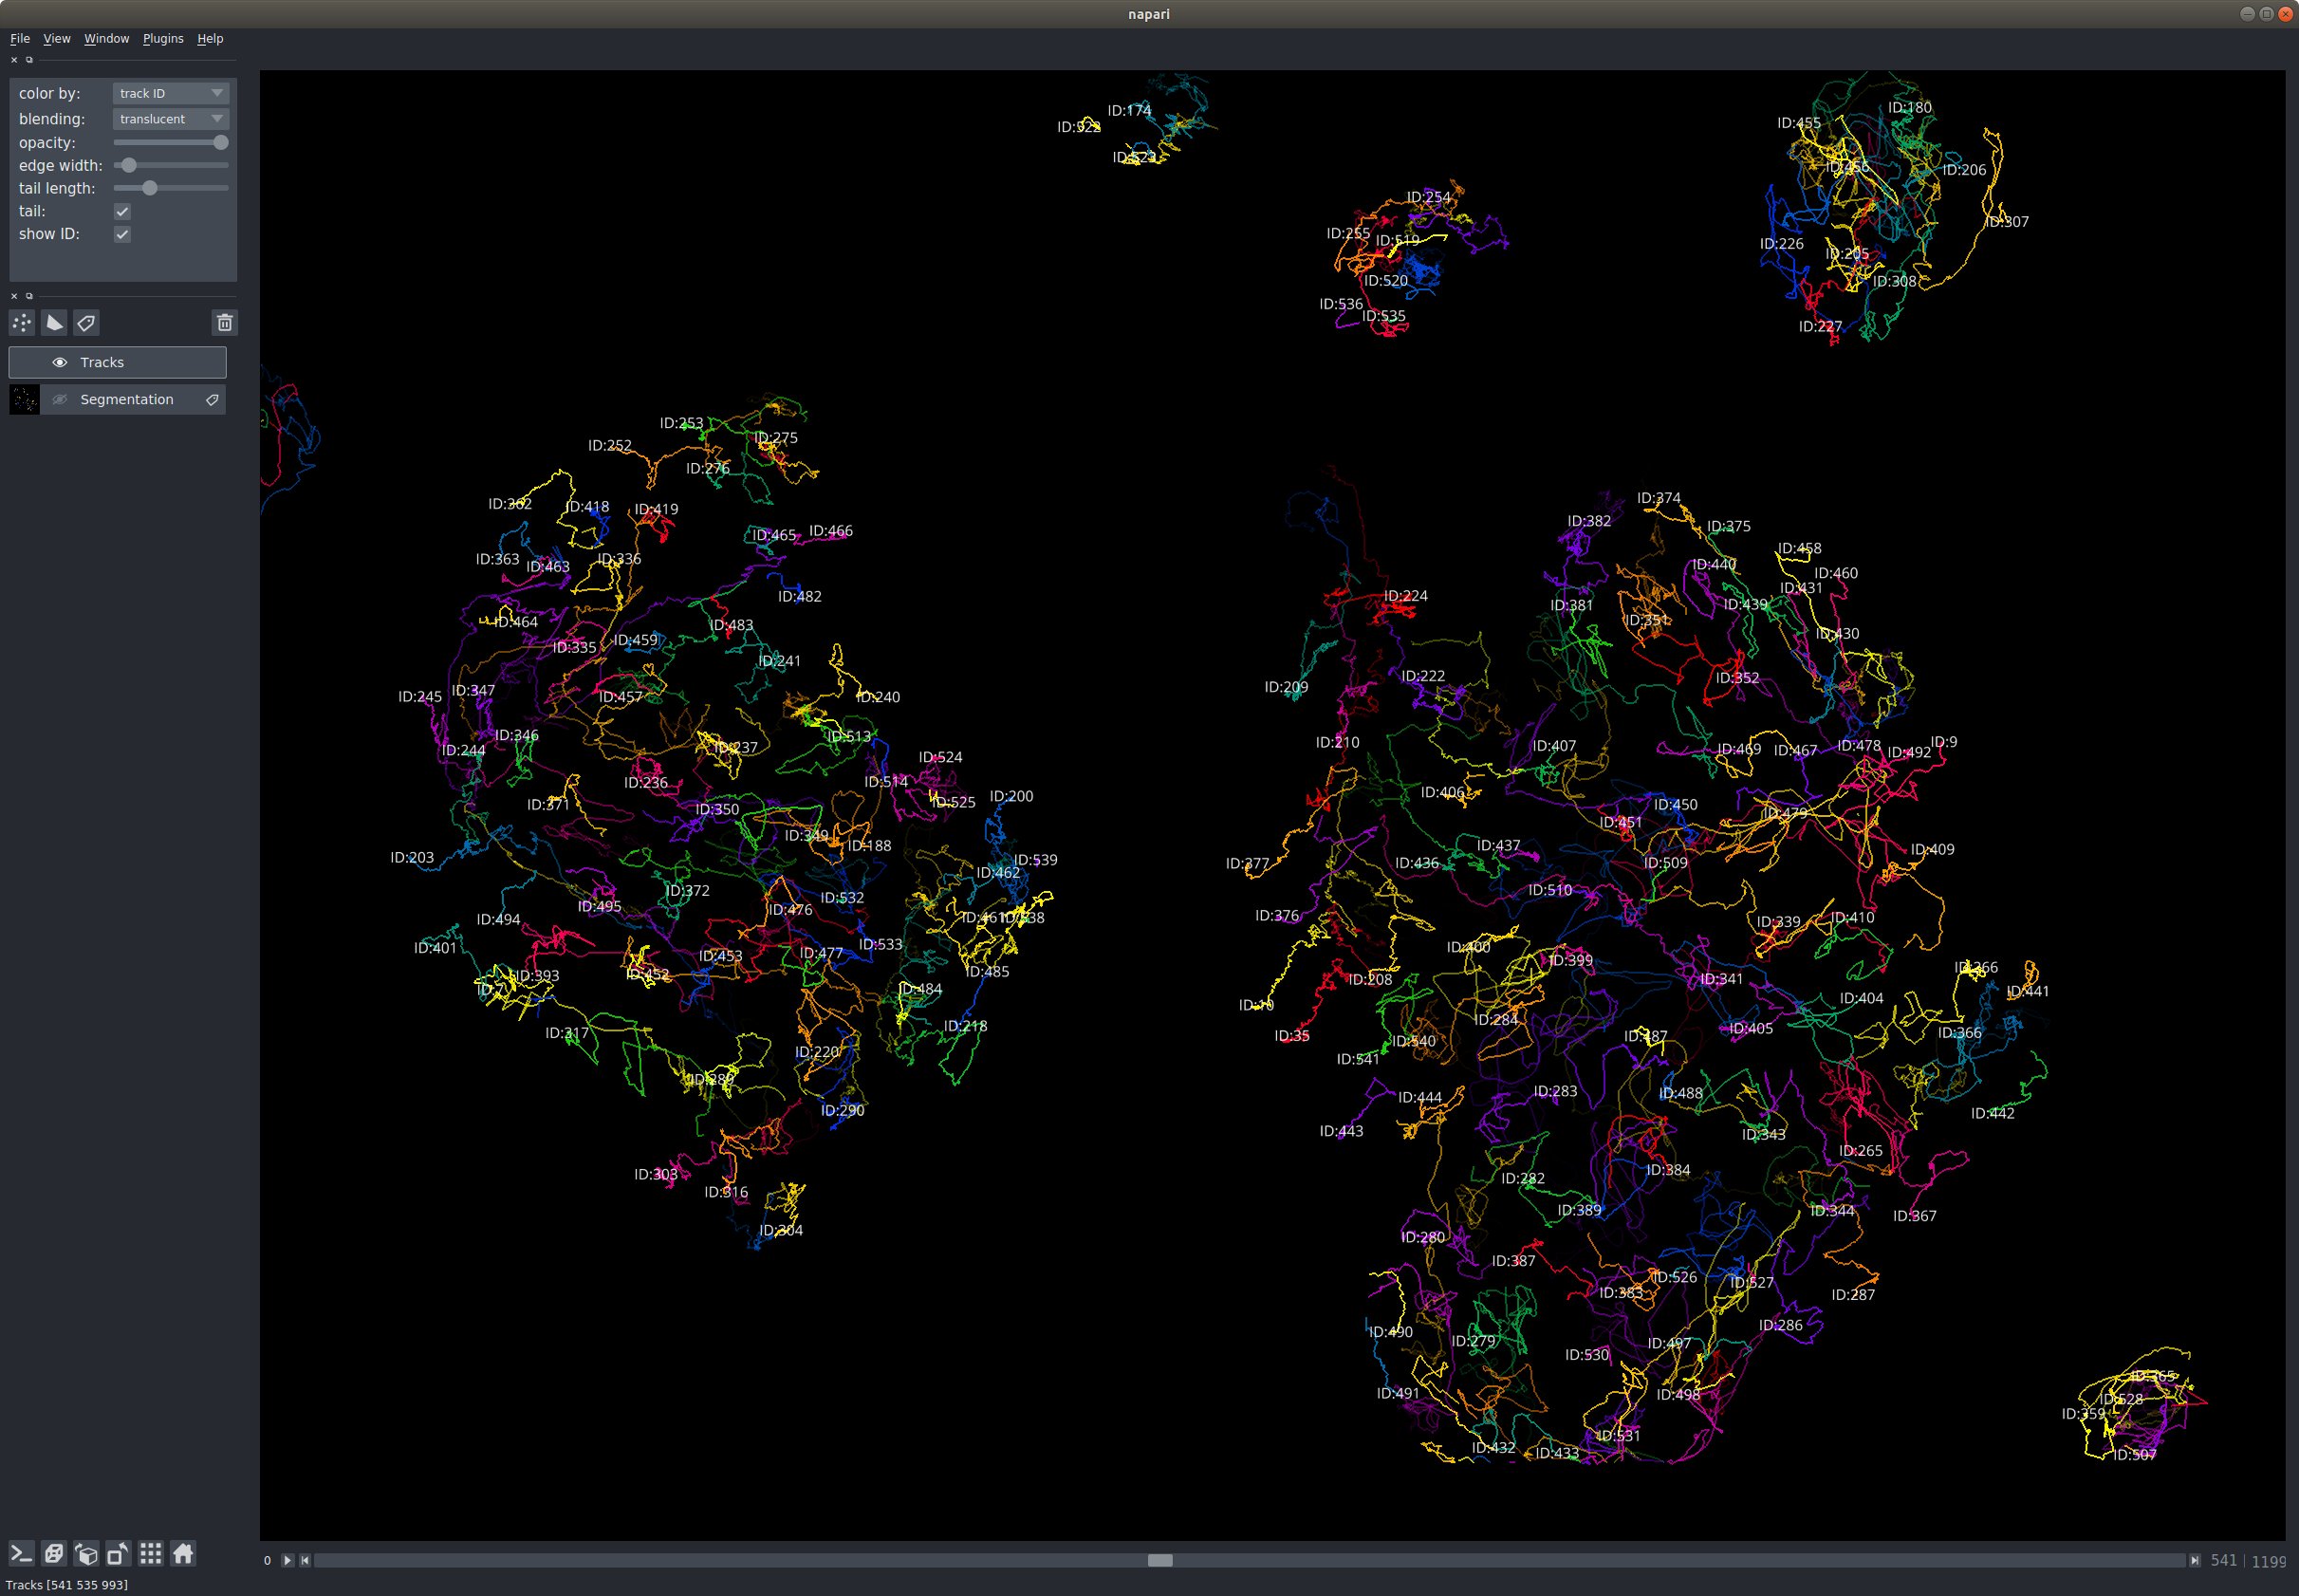
4 years ago

@royerloic how do you feel this functionality intersects with the current Path object in the shapes layer? For example see this WIP PR #532 for examples of lines in 3D? You can pass a list of NxD arrays as input and a list of colors and it will do 2D and 3D rendering. It won't change transparency along the line, this could be done, but unclear if it is needed functionality. There's also only one global width for each line right now.

royerloic commented 4 years ago

Yes this looks like a good starting point! One possibility would be to subclass 'paths' to 'tracks' adding features specific to spatio-temporal tracking as described above. This is something we could work on with @pranathivemuri . Could be exciting feature.

sofroniewn commented 4 years ago

There might be some general interest in more advanced coloring options for the paths from other communities too, I thinking about some of the track tracing people from diffusion tensor imaging for example, https://dipy.org/, and I've been chatting with @arokem about some example datasets from that space too, but starting with subclassing sounds good, and I'd be excited to get more contributions from @pranathivemuri!! The 3D stuff is really coming along now.

Unfortunately one things that we're coming up against is that right now the way the Shapes layer is architected has a lots of generality but at the expense of some performance issues, so we struggled with 1000s of paths for example, but that could be improved with some profiling and better design decisions maybe

royerloic commented 4 years ago

Sounds good. My guess is that you have a list of vertex/face data , one for each shape or so... Whereas for performance you would want to have it all packed into single arrays... Is that the case? We can also just tailor-made a layer just for tracks that could handle tens of thousands of tracks... Subclassing might not be the right way then, because it creates shallow dependencies and prevents performance optimisation.... We should think about it...

royerloic commented 4 years ago

Maybe, we should keep shapes as a generic and rich layer, but also have specialised and optimised layers that are very good, and very fast, for specific types of data. In the end everything is built upon vispy, but we don't force ourselves to square the circle. Sometimes, It can be difficult to truly have both generality and performance... Also, it might be easier to maintain specialised layers that directly build on vispy because this avoids creating unnecessary dependencies in our code. Might a tad little bit more work. What do you think @jni ?

sofroniewn commented 4 years ago

We basically use both representations - we take data in as lists of arrays and then convert it to a giant array of vertices and triangle that vispy will accept. Right now generating that giant array is pretty slow for reasons that aren't surprising - each time we add a shape it does all sorts of concatenations to that array (instead say of first figuring out how big that array will need to be and then making it once).

There's also some math right now that's a little slow that calculates the triangles but that we could certainly speed up with Numba if we wanted to.

I think we should look into optimizing what we have inside Shapes first, as I think it should be pretty easy to improve things, and will make performance better for everyone using that layer, before we go down paths of supporting many specialized layers, especially if the api to interact with the layer would be the same as in shapes.

jni commented 4 years ago

I'm into a "tracks" or "connections" layer. It works not just for tracking but also e.g. for skeleton tracing of neurons in 3D data.

I don't have much to add to the discussion about performance except I do think that this is a separate kind of layer from shapes. I might even consider ripping out lines from shapes altogether, and have 0D (points) 1D (lines/tracks/connections) 2D (shapes/surfaces) and 3D (volumes) object layers.

Regarding data representations: ultimately with arrays you are going to struggle because these data are jagged, ie some paths have 4 vertices while others might have 40, which makes it hard to represent them in a compact, homogeneous array. For skan I use an array of coordinates and a CSR matrix to represent paths, but this is not a data structure that is easy to edit. Perhaps one option is a dynamically-expanded (N, 2) array, where N is the number of segments, and an (M, D) array that represents coordinates of the points referred to by the segments array. Again, by stepping out of the shapes layer we can use representations that are much more efficient.

royerloic commented 4 years ago

I buy @sofroniewn argument that reimplementing interactivity for each layer would be expensive, so it makes sense to first optimise shapes and then se how far we can go. From @sofroniewn description of the implementation, it sounds that the fundamentals are solid and it would be feasible to optimise the array generation.

One question @sofroniewn: once the 'giant array' is generated, I assume that rendering speed and scalability is good right? How big can you scale the number of vertices and faces? If the bottleneck is just the array generation and not rendering then we definitely should optimise that and subclass...

VolkerH commented 4 years ago

Having the possibility to display such tracks both in the 2D and 3D view and show future and past positions (increasingly faint and transparent as you go away from the current time point)

This gave me an idea that would be useful for proof-viewing tracking results. A feature such as in stop motion animation software where one can see the previous frames as gradually fainter overlays. That would not be a vector primitives layer but a pixmap layer (so really a separate but related issue). Could be implemented using the existing layer/blending mechanism with a few tweaks.

royerloic commented 4 years ago

That's a great idea! Indeed a simple trick is to have layers for t-2, t-1, t, t+1, t+2 etc... and have them configured with the correct opacity and color... Can be built with existing building blocks. Very cool idea indeed. The questions is whether a dedicated layer is needed or not.... Perhaps not.

pranathivemuri commented 4 years ago

From the discussion and feedback from @royerloic today, I might try to get this working now using the discussion in this issue and getting some inspiration from some first tracking steps, (points, shape layer combined into a tracking layer probably) @guiwitz - https://github.com/guiwitz/napari_demo/blob/master/napari_3d_image_processing.ipynb

@kevinyamauchi @sofroniewn I might come to you guys soon to discuss if I am stuck, just giving a heads up, thanks!

royerloic commented 4 years ago

Would be interesting to gather here, in a first step, what people think should be the feature of such a layer...

mkitti commented 4 years ago

A few years ago the Cell Migration Standards Organization @CellMigStandOrg assembled a group to put together a biotracks standard: http://cmso.science/Tracks/ https://github.com/CellMigStandOrg/biotracks

The preprint describing this effort as well as other standardization efforts is located here: Community Standards for Open Cell Migration Data https://www.biorxiv.org/content/10.1101/803064v1

It would be great to work with Open Microscopy Environment and CMSO to ensure data interchange.

I've worked with the Jaqaman and Danuser labs on track display in u-track in MATLAB. Since tracks can get complicated, we also including support for marking when tracks split or merge as well as, gaps in tracks, and marking when tracks start or end. https://github.com/DanuserLab/u-track/blob/master/software/%40TracksDisplay/TracksDisplay.m

Another important feature is to be able to identify displayed tracks and trace them back to the source data.

mkitti commented 4 years ago

Also see the discussion on image.sc: https://forum.image.sc/t/emergence-of-a-standardized-common-file-format-for-cell-and-single-particle-tracking-data/30829

sofroniewn commented 4 years ago

There might also be some intersection here with some of the issues discussed in #693 (visualizing 3D segmentations of neurons, axons + dendrites) and @DottedGlass and @padster might also be interested in weighing in

reyesaldasoro commented 4 years ago

Have you seen the tracking and visualisation tool called phagosight:

https://github.com/phagosight/phagosight

Some of the visualisation tools may be useful:

https://github.com/phagosight/phagosight/wiki/User-Manual-7

quantumjot commented 4 years ago

I second this. I think a specialized tracklet layer would be really useful.

Beyond the ability to color/change opacity of segments of the tracklets and associate these with metadata (such as time or state), it's also really useful to have a text box displaying the track ID. This is essential when debugging the output of tracking. I implemented something similar here in this video: https://www.youtube.com/watch?v=EjqluvrJGCg

royerloic commented 4 years ago

Thank you all for your interest, ideas, and ressources! Greatly appreciated!

Let me perhaps define more clearly the scope of what we have in mind by stating what this issue is about and what it is not about:

not about: i) Defining a file format for tracking data, ii) Conceiving a 'universal' data model or standard for tracking data, iii) Designing a fully featured tracking tool, iv) writing loaders from standard tracking file formats into python.

Having said that, the resources shared here provide us with some perspective on what people typically expect from a track visualisation. Very useful.

about: i) Designing and writing code for a configurable and versatile napari layer that is just a visual representation of tracks in nD+t ii) Discuss features that such a visual representation could expose.

One principle of napari is not to build tools, but to build the building blocks so that the tools are easy to build in a few lines of code. We don't prescribe how should the tool look like in details, we let you build anything with powerfully versatile building blocks. It's lego versus ready-made.

We will get started with something very simple and seek feedback and possibly help here.

padster commented 4 years ago

From the SWC use-case mentioned in #693, the main thing I can think is that we have a very related problem when drawing 3D lines onto the 2D plane projection. Currently you can draw 3D line shapes, but in 2D mode you only see the intersection with the viewed plane. Ideally, you would also see the segments nearby the current Z, ideally increasingly faint and transparent as you go further.

The constraints are different (i.e. unlike time, our Z are not monotonically increasing, and our underlying 2D plane is changes too depending on the Z), so I wouldn't consider the data model to be similar, but if the visualization of a 4D track (XYZ + time track) in 3D can also work for a 3D track (XY + Z) visualization in 2D, that would help generalize it for our SWC too.

danielballan commented 4 years ago

There might be some useful inspiration available in the tracking library https://soft-matter.github.io/trackpy/v0.4.2/ and associated visualizations. cc @nkeim

pranathivemuri commented 4 years ago

I have started working on the tracklet layer Here is the branch - https://github.com/napari/napari/compare/master...pranathivemuri:pranathi-track?expand=1

Ignore the many changes in my branch, I wanted to have a proof of concept for myself for adding a new layer, I can refactor and make the PR and code smaller as needed.

Right now it is setting shape_type="path" from shapes layer. Maybe I can just inherit from Shapes layer and avoid all of that. The things I am imagining for the tracklet layer are paths shown with lines and points. Lines connects the points. Points are spheres and when you hover over them maybe they show the point coordinates in (x, y, t) They might look something like the below figure.

Screen Shot 2019-12-05 at 1 53 28 PM

sofroniewn commented 4 years ago

@pranathivemuri very cool to see this get started, but it's not clear to me what this approach is achieving vs just directly using the shapes layer. For example you can achieve a visualization exactly like the one you linked to with a singe call to view_shapes:

path = [[505, 60], [402, 71], [383, 42], [251, 95], [212, 59],
            [131, 137], [126, 187], [191, 204], [171, 248], [211, 260],
            [273, 243], [264, 225], [430, 173], [512, 160]]
polygons = [path] + [[list(c), [10, 10]] for c in path]
shape_type  = ['path'] + ['ellipse'] * len(path)
napari.view_shapes(polygons, shape_type=shape_type, edge_width=5, opacity=1,
                              edge_color='coral', face_color='royalblue')
Screen Shot 2019-12-05 at 5 17 28 PM

I think before we go to far with coding we should maybe try and get some screenshots or gifs in this issue so we can see exactly what we are aiming for. Or we should run some benchmarks to determine exactly how far we can get with Shapes before we need to start optimizing there or move to different data representations

mkitti commented 4 years ago

If you need some example tracks, check here: https://github.com/CellMigStandOrg/biotracks/tree/master/examples https://github.com/CellMigStandOrg/CMSO-datasets/tree/master/cmsodataset0001-masuzzo/trackmate/2_B/dp

sofroniewn commented 4 years ago

@pranathivemuri following up, another way to start might be for us to define an add_tracks method in viewer the just takes in data in the format you want and then does a conversion internally to the data objects needed to make a single call to add_shapes to add a single Shape layer that results in the desired visualization.

This approach would allow us to work on the API of tracks without having to add a new layer type and should be a relatively small and self contained PR that doesn't break any backwards compatibility. All the heavy lifting would be in ViewerModel call and apart from adding a simple view_tracks method, maybe some utils, and tests no other parts of the codebase should actually have to change.

We would then be able to see what part of shapes was actually being used to make the tracks, what additional UI functionality we are lacking, and what UI functionality from shapes is not needed etc before doing any refactoring. This would be similar to the approach we took with add_multichannel which then ended up inside add_image.

I think you also might be able to achieve the majority if not all the desired track functionality - fading with opacity in time, different duration time display, branching and everything else that has been asked for from a model perspective with this approach by leveraging a combination of the Line, Path, and Ellipse shapes. By falling back to Line objects where can line segment each have its own thickness, color, and opacity you have complete flexibility to make any set of tracks. Eventually we might need to add custom UI functionality like a slider to control the extent of history that is rendered, and that might lead us towards more customization, but that can come later. Similarly we might hit performance limits with many tracks that will drive us to more specialization and optimization in time, but we've never done any benchmarking on Shapes and there's probably quite a bit that can be sped up very quickly. Overall, add_tracks would be similar to the approach I took here https://github.com/napari/napari/issues/693#issuecomment-554000321 where the goal was to refactor input swc data into a format that add_shapes understood.

If we're interested in this approach, then probably the first thing to do before writing any code is define the function signature and doc strings for add_tracks. I know there have been some great links posted to repos above where we can see the approach other tools have taken to defining this api but it would be great to synthesize that information and put a candidate api here that was equivalent to this block https://github.com/napari/napari/blob/c0556a6a161ee4b6faa85f93c37408512395614d/napari/components/viewer_model.py#L756-L831 but for add_tracks, where we thought about the primary input type, (lists of arrays? or array of coordinates and a CSR matrix? or (N,2) array of segments and (M,D) array of point coordinates) and key keyword arguments (lists of branch points?, lists of parent nodes?, history duration? color scheme?) etc. maybe also tackling concepts like branching and skeletons etc that @jni has been talking about too.

mkitti commented 4 years ago

@sofroniewn The shapes reminded me of a discussion we had with OME about the data model for tracks. We may not want to assume that we are necessarily connecting points in space.

Rather we may be connecting objects. Those objects may be described by any number of ROIs: https://docs.openmicroscopy.org/ome-files-cpp/0.5.0/ome-model/manual/html/developers/roi.html . Each ROI describes some kind of a location in space and time. For the initial implementation, it may be easiest to reduce each ROI to a point, such as the centroid, but perhaps in the future we may want to draw lines between the nearest points on the boundaries or end points of two objects rather than their centers, for example.

My suggestion would be that the two main arguments would be 1) a list of shapes and 2) a list of lists of shape indices in the first array representing linear links between the shapes. Linear links are the simplest kind of track where objects are connected via one-to-one relationships without gaps such as the example you gave.

Additionally parameters may influence how to render those shapes and the links between them. An advanced parameter would be a set of metalinks which relate the sets of linear links together and allow for many-to-many relationships that could cover concepts like splitting, merging, and gaps.

A "track" therefore would consist of a set of objects connected by links and the metalinks between them. If we were tracking bacteria dividing, the objects would be the outlines of each bacterial cell. The linear links would relate outlines between frames. The metalinks would describe division events. Their track would resemble a cell lineage binary tree.

Abstracted this way, one could swap in a different set of object shapes while maintaining the same set of links and metalinks. One example would be if the bacteria being tracked is a caulobacter colony. Maybe instead of tracking the cell body we may want to switch to tracking the stalk.

quantumjot commented 4 years ago

I had an attempt at using the idea from @VolkerH for separate path layers for t0, t-1 etc.

In each layer, there are Path linking that time point to the previous one, so that as you move through t there is a comet tail reaching t-n observations into the past. Each layer has an opacity set such that the line fades with history. I think the visualization looks quite nice:

Stack

...but, performance rapidly becomes an issue once the number of tracks increases beyond a few objects.

Could the edge_color property allow RGBA, or even n x (RGBA)? In that case the extra layers would not be necessary.

sofroniewn commented 4 years ago

Very cool @quantumjot - you should be able to pass an N x RGBA array to both edge_color and face_color right now where N is the number of shapes and each shape will get colored with the appropriate colors. Right now it is not possible to color the individual line segments of a path differently (we could but would need to think about the API), but I don't think that is needed as you can always make smaller paths or use the line object which is just an individual segment.

Lets say you have M objects in your scene and T timepoints then you're going to want to construct a length N = M*T list of arrays that will be Path objects and then an Nx4 array of RGBA values that does the appropriate coloring and fading and then make one call to add_shapes. As I was mentioning to @pranathivemuri above, one step for us would be to that transformation for you.

Thanks also @quantumjot for the link to the youtube video above it was very helpful. As to text by all the tracks we're working on an independent text layer right now in #600, but having discussions about how to integrate text with our other layer types in #651.

I'd love to see a gif like the one above but with a single add_shapes call!

sofroniewn commented 4 years ago

Making sure we easily support data from http://celltrackingchallenge.net/ is probably a good idea - h/t @mkitti - https://twitter.com/markkitti/status/1203390337944821762

pranathivemuri commented 4 years ago

ISBI Cell tracking challenge stores trajectory/track paths by saving L, B, E, P which is Label of the track, Beginning frame where the track appears, Ending frame where the track stops, Parent cell if defined respectively. In addition to these, we should also save the centroid of the track at the beginning and the ending frame(we can make a class for this or just have the user set these keys in the dictionaries with values as lists). By saving just this, we will save the lineage and track ids of different tracks, but we cannot save how the centroid of the track moves. I think one way would be to save this info in metadata dict in add_shapes or add_tracks function after we have added one and use that to render the text for track ids, beginning centroid, ending centroid ellipses. Because if we have centroids for every point in the path it might be cluttered and we probably can't see the data. https://github.com/napari/napari/blob/master/napari/components/viewer_model.py#L766

The input data for this add_track function can still be all tracks as a list of numpy arrays of the centroid of the tracks, [x, y] or [x,y,z] changing in time format. This will help us keep track of how a cell centroid path moves/curves around. Saving the centroids of tracks in data and centroids in metadata dict enables us to 1) save the skeletons and their branching and ending points as well and display them, in the same way, using the same function as tracks and 2) Metadata here is optional if metadata is none or empty dictionary it will just draw paths

how does that sound?

sofroniewn commented 4 years ago

@pranathivemuri thanks for digging into the cell tracking data representation. Looking at the link and reading your comments it seems to be like we need to support two key data objects, one centroids / labels which contains either the centroid information or full labels information. centroids would be a list of numpy arrays where each array is TxD where T are the T is the length of time the object exists for, D is the dimensionality of the data. labels would be full nD labels data with 0 background and ids for labels otherwise. We'd convert that to a centroids representation immediately. The other information is a lineage matrix, which I think we should assume to be Nx4 and in the LBEP format (we can always convert or provide utils to convert from things like the SWC file into a centroids + LBEP representation

The API would then look as follows

add_tracks(data, lineage=None, ...)

where data is either centroids like or labels like, and if lineage is not provided just the paths get rendered, if it is provided then special things happen. If we use labels data we can actually also trigger a call to add_labels to show that data as well in its own layer. With this scheme we can avoid using metadata

How does all of this sound to everyone?

pranathivemuri commented 4 years ago

here is the branch with the changes to start adding track layer with lineage matrix - https://github.com/napari/napari/compare/master...pranathivemuri:pranathi-track-viewer?expand=1

quantumjot commented 4 years ago

Ping

I'm slowly adding some details of the track layer I've been building. I decided to build it externally to napari for the moment (as part of a plugin). But I'm linking the part of the repo with the nascent code here:

https://github.com/quantumjot/arboretum/tree/master/arboretum/layers

track_layer

A few technical points:

# NOTE(arl): use this code to register a vispy function for the tracks layer napari._vispy.utils.layer_to_visual[Tracks] = VispyTracksLayer napari._qt.layers.utils.layer_to_controls[Tracks] = QtTracksControls

Would be curious to know any thoughts on this. Also, I'm certain I don't fully understand the internal dynamics of the napari layers yet, so any pointers would be useful.

tlambert03 commented 4 years ago

@quantumjot, this is super exciting. amazing work... from quickly looking at it, I also think you've matched the general napari patterns really well and it would be relatively easy to incorporate this!

I've abused the layer_to_visuals dictionary to register the track layer from the plugin.

we've basically left you no choice! 😂 There is an issue mentioning the difficulties that dict poses for custom subclasses here: https://github.com/napari/napari/issues/1176. Given the limitations, I think you've done quite well! Should be an easy fix though, in some other PR.

the Track layer is using a TrackManager class to coordinate all of the track info

I tried to see what the TrackManager was but couldn't easily find it in the source... seems to be coming from a nonexistent _track_utils module? Anyway, I think you're probably right... ultimately i think we'd want to be able to build track info from any ArrayLike (though of course, all of our layers make some basic assumptions about the structure/dimensionality of their corresponding data inputs)

quantumjot commented 4 years ago

@tlambert03

seems to be coming from a nonexistent _track_utils module?

It should be there now!

The TrackManager was for two reasons (i) it was easier to manipulate the incoming data and (ii) it stops the layer having such an overhead when you instantiate it. Would be easy to change though

jni commented 4 years ago

ultimately i think we'd want to be able to build track info from any ArrayLike

I haven't worked with tracking data before, but I suspect that there's things like jagged arrays, tree structures (for cell division), and other goodies not easily shoved into a rectangular grid. @quantumjot what does the actual track data look like? We don't actually always have data as a "single array". For example, surfaces are represented as a (vertices, triangles, values) tuple. So I think in this case we should work with whatever is most natural for tracks.

jni commented 4 years ago

Also, everything @tlambert03 said! Welcome, super exciting, so great to see you here. =D

tlambert03 commented 4 years ago

yeah, I guess what I meant is more that it would be nice to step back and say "what kind of data is this layer representing"... (as has been done with all the layers). For me, one of the most useful things about napari is simply the abstract model of different types of analysis products. So if this is very close to an "arbitrary ndTree layer" (even if track data is the only concrete use case), then that would be awesome. That said, I also know very little about track data! I don't know how "similar" different tracking products are (between different packages)... but if this could define a data model that could be broadly applicable, (rather than accept an instance of a specific implementation) all the better.

quantumjot commented 4 years ago

what does the actual track data look like?

@jni, it's reasonably efficient to store the data in a tuple of arrays format, like this: https://github.com/quantumjot/BayesianTracker/blob/6b3cb6f8f704178c1f4a66de40deb2bccfbbf7c1/btrack/dataio.py#L278

it's a hierarchical organisation: points -> tracks -> trees/graphs

I think the issue is mostly how you efficiently slice these data for visualization. But the shader trick seems to work pretty well as a first approx.

quantumjot commented 4 years ago

@tlambert03 I've refactored the Tracks layer to accept a list of (N x D) arrays as input data, and removed the track manager. Each array in the list represents a track (first dimension is time, following are spatial dimensions). I was thinking that we could use the metadata to store details of the graph that connects these tracks, and provides additional metadata such as state and so on. In that way the data structure could be used for trees as well as graphs.

Regarding the trees vs graphs - in some domains we care about track splitting (for example cell tracking with cell divisions) and in others, merging is important (e.g. single-molecule tracking), so a general graph structure, rather than a tree may be more appropriate. I could imagine the metadata storing a sort of adjacency matrix which captures these connections.

What do you think?

mkitti commented 4 years ago

In single particle tracking applications, you often have both splitting and merging events. Also note that you can have gaps in the data when fluorophores blink.

quantumjot commented 4 years ago

I've created a branch with the Tracks layer here: https://github.com/quantumjot/napari/tree/track-layer

Is it worth opening a PR?

jni commented 4 years ago

@quantumjot yes, please do! In the worst case it gets closed, but it is very helpful to be able to look at the diff and get more eyeballs on it!

sofroniewn commented 3 years ago

This is closed by #1361!

sofroniewn commented 3 years ago

I'd encourage anyone on this thread to checkout the new Tracks layer that was added in #1361, and feel free to open a new issue if you have any feedback or requested improvements!! Thanks to all who gave input on this thread, especially @pranathivemuri who got it started, it was definitely very helpful and a huge thanks to @quantumjot who did an amazing job with the PR!!