 deluan
commented
1 year ago
deluan
commented
1 year ago So it was with a previous version, correct? Let me know if you run into this issue with the latest (0.48.0) version.
Closed HipyCas closed 2 weeks ago
deluan
commented
1 year ago So it was with a previous version, correct? Let me know if you run into this issue with the latest (0.48.0) version.
 HipyCas
commented
1 year ago
HipyCas
commented
1 year ago I'll keep an eye on the memory usage and come back to this if the is a memory spike again.
 strider-
commented
1 year ago
strider-
commented
1 year ago I just ran into this issue today. Running navidrome in a docker container on my NAS and it was taking 10.4 GB of memory. It had been up for 29 days before I noticed the excessive usage
edit: Using version 0.48.0
edit 2: 3 days later, and it's using 2.6 GB RAM, and it's currently idle (not scanning/streaming)

deluan
commented
1 year ago Could this be a duplicate of https://github.com/navidrome/navidrome/issues/1874 ?
strider-
commented
1 year ago Could this be a duplicate of #1874 ?
I'll give the latest dev build a shot (develop tag in Docker?) and see if it addresses the issue
HipyCas
commented
1 year ago Could this be a duplicate of https://github.com/navidrome/navidrome/issues/1874 ?
I don't think so, the high memory usage was happening for a long time and I don't remember scanning the library while then.
deluan
commented
1 year ago I don't think so, the high memory usage was happening for a long time and I don't remember scanning the library while then.
The default is to scan every minute, unless you changed the ScanSchedule config option.
strider-
commented
1 year ago After running the dev build for a few days (Version: 0.48.0-SNAPSHOT (db6e8e45)) it looks like the issue is still persisting :(

HipyCas
commented
1 year ago It's happening again, not using it rn and neither UI nor docker logs show anything about scanning the library. Anywhere that I can look to get more info and maybe know where the ram usage comes from?

 dessalines
commented
1 year ago
dessalines
commented
1 year ago I'm also getting this... very strange spikes in CPU and memory after navidrome has been running for a few days.
 xr09
commented
1 year ago
xr09
commented
1 year ago I'm experiencing something similar. Even though my Navidrome instance is mostly idle (I'm the only user) and the library is very small, I'm surprised to see the memory usage has been growing at a steady pace for the last two months.

 JulienSambre
commented
1 year ago
JulienSambre
commented
1 year ago Hi!
I installed the docker version (deluan/navidrome:0.48.0) of Navidrome a few days ago (moving from Funkwhale) and so far it works like a charm (really a good piece of software comparing to the alternatives), except this big memory leak.
I set nothing in the container except the log level, so Navidrome scan my library (almost 30 Go) every 1 minute.
I noticed several things :
For now, I will put the max memory to 300 Mo (should be enough for me) and restart the container every day. Not wonderful, a fix would be fantastic, seems to be a very classic memory leak issue ;).
 cceckman
commented
1 year ago
cceckman
commented
1 year ago A little bit of data:
I've also seen slow-but-steady increases in memory usage while Navidrome is running on my system (Raspberry Pi 3, NixOS). I'm on the default schedule of @every 1m for scanning.
I tweaked my Navidrome instance to include the pprof http handler (commit). (That's not pull-ready, just a hack.) I took an allocs sample a few minutes after starting the process, and another this morning, to try to see where the memory is going.
The pprof snapshots are, so far as I can tell, the same. I'll check again after having run longer.
cceckman
commented
1 year ago Here's the last two days:

That's a pretty high growth rate- 35MiB in the last 24h. allocs pprof still shows no growth. I think this is still a problem at HEAD, and not in the Go layer per se. (Maybe not even in Navidrome- we'll see.)
I see this commit showed up in 0.49.2. That's one kind of leak closed from earlier versions. I don't think it'd be the one shown above, though - a file left open for streaming would be a file-backed page, not an anonymous page, and the kernel should be free to evict it (& re-fault it in).
If I understand correctly, Navidrome uses sqlite as its backing data store - via database/sql and mattn's sqlite driver; might there be something in that layer that is causing steady growth (sqlite fragmentation)?
cceckman
commented
1 year ago I realize there was a confounding factor on my system: I had Prometheus running on the same node, which was eating at least some memory / pages / etc. I've restarted everything at Navidrome 0.48.0, and am keeping a log of system.slice/navidrome.service's memory usage (asking systemd-cgtop) as well as node-wide usage (from node_exporter).
cceckman
commented
1 year ago A little more specific data: here are the outputs from some hourly crons, invoking systemd-cgtop on Navidrome's slice in particular, and on the system as a whole. This is with "normal" usage - there are at most two users, and we're using it fairly lightly.
the Navidrome slice in particular, and (for part of the time) on the system as a whole. Navidrome's usage is steadily, though not monotonically, increasing. No other slice seems to be occupying much.
This isn't a "patched with pprof handler" version, it's just Navidrome 0.48 as build under Nix.
I can say: It doesn't appear the DB is contributing significantly; at latest read:
rack3% sudo ls -lah /var/lib/private/navidrome
total 41M
drwxr-xr-x 2 navidrome navidrome 4.0K Feb 20 16:18 .
drwx------ 3 root      root      4.0K May 21  2022 ..
-rw------- 1 navidrome navidrome  37M Mar 10 23:20 navidrome.db
-rw------- 1 navidrome navidrome  32K Mar 10 23:49 navidrome.db-shm
-rw------- 1 navidrome navidrome 4.2M Mar 10 23:49 navidrome.db-wal
So- it sure seems like memory is going somewhere in the Navidrome envelope.
deluan
commented
1 year ago Hey @cceckman , thanks for the information. Can you try the same, but with the scanner disabled (ScanSchedule = "0")?
cceckman
commented
1 year ago Sure thing. Next batch of changes under test:
/metrics endpoint properly, to get that data stream as well.Will report back after it's run a while.
cceckman
commented
1 year ago With the above - much more stable: navidrome-container-monitor.log
~150 MiB idle after startup (and maybe after an initial scan?), with no usage; I see that doubled to ~338 MiB when I played some music and stayed there, but isn't "just" increasing.
The Prometheus metrics don't show anything super interesting over time. go_memstats and process_resident_memory_bytes both show much smaller values than systemd (process_resident_memory_bytes < 60MiB)- but if I'm reading right, the cgroup numbers also covering some portion of file / cache that /metrics don't cover. So that's not really a concerning difference.
I have a tweak to the cron-monitor to capture the detailed meminfo (/sys/fs/cgroup/system.slice/navidrome.service/memory.stat).
Should I reenable the automated scan to see where the ballooning is accounted to? Or trigger some manual scans to see what happens?
cceckman
commented
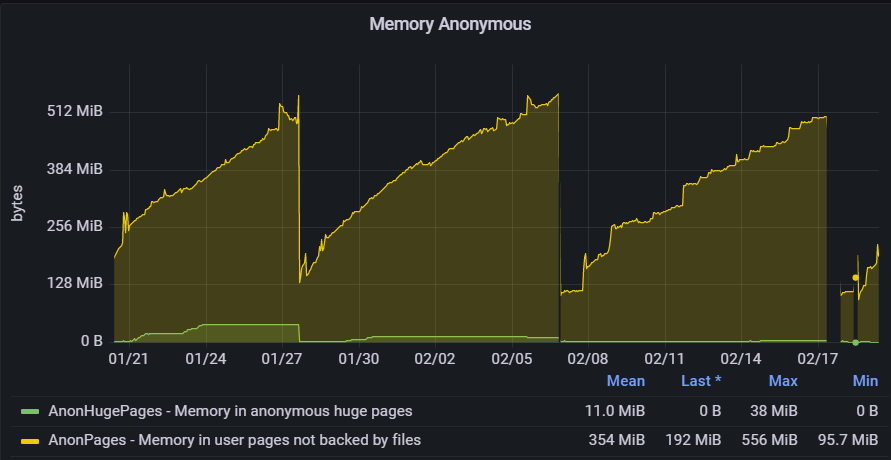
1 year ago Back with more data- the CSV file with samples of memory.stat from above: navidrome-container-memstat.csv First column is Unix Epoch, the rest of the fields are from sysfs.
It seems pretty stable for a couple days... until, due to New Music (yay!) we ran a scan.
We ran a manually-triggered quick scan on 2023-03-18 ~10:43, and then a full scan at ~10:55 (US Eastern Time.) After that, we've had 2-3 streaming clients via web UI or DSub.
Eyeballing a chart from that CSV - the "file" counters come up during the scan, and never go all the way down. In particular, the active_file count never entirely goes back down.
Two other data sets, from the Prometheus metrics (note: Eastern Time timestamps, so offset from epoch time):
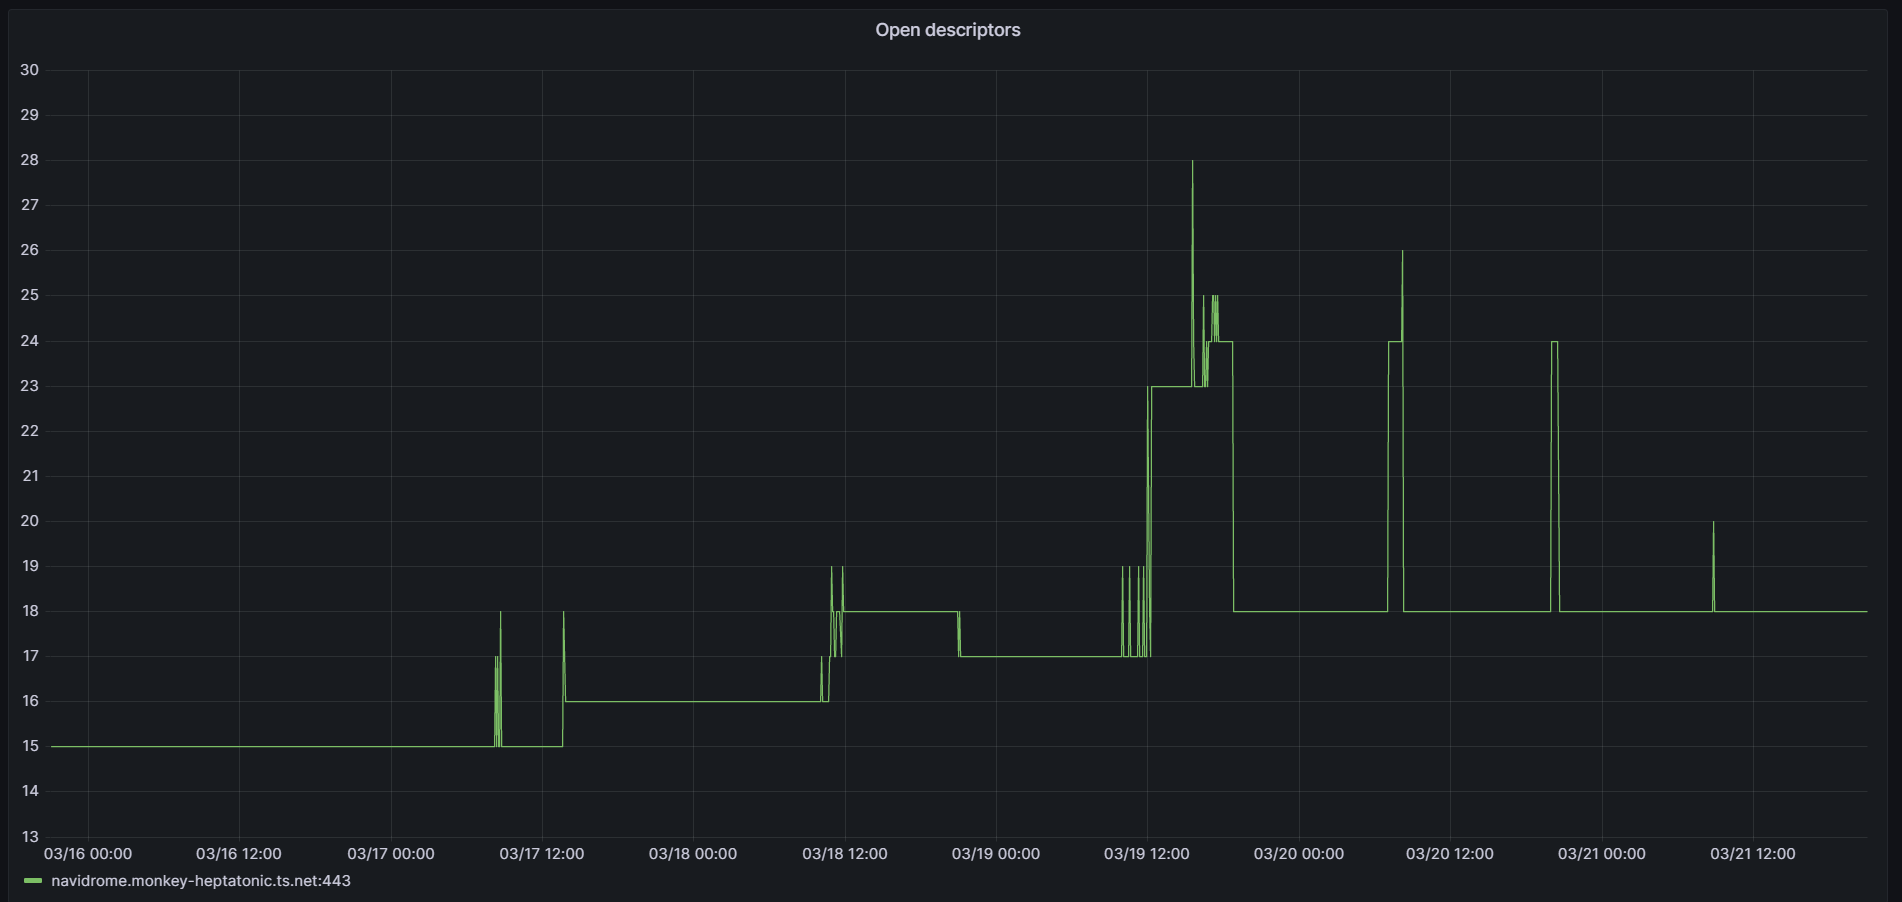

The "raise-to-plateau" of the thread count aligns with the triggered scan, ~10:43. I don't have an immediate explanation for the open descriptors increasing before then (might have streamed something?)
 github-actions[bot]
commented
8 months ago
github-actions[bot]
commented
8 months ago This issue has been automatically marked as stale because it has not had recent activity. The resources of the Navidrome team are limited, and so we are asking for your help.
If this is a bug and you can still reproduce this error on the master branch, please reply with all of the information you have about it in order to keep the issue open.
If this is a feature request, and you feel that it is still relevant and valuable, please tell us why.
This issue will automatically be closed in the near future if no further activity occurs. Thank you for all your contributions.
 johndoe0815
commented
8 months ago
johndoe0815
commented
8 months ago I can add on this.
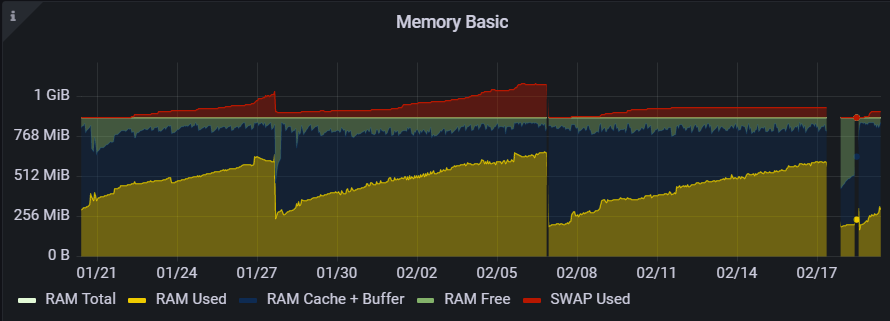
I have Navidrome running in a Proxmox container, mostly idle, not using it much with only me as only user. I gave the container 1GB of RAM, and this was slowly eaten up over time:
I then restarted the container, reducing the memory consumption drastically, but without having accessed Navidrome even once since then, it is again slowly increasing.
There must be any memory issue which at the moment would require to restart the container from time to time.
I do not have this with other services running in the same kind of way.
johndoe0815
commented
6 months ago Is there any solution in sight?
I keep restarting the container from time to time, but even without using Navidrome at all, memory consumption constantly increases over time until next restart:
 markasoftware
commented
6 months ago
markasoftware
commented
6 months ago I don't believe any solution is in sight. I'm experiencing exactly the same thing as you @johndoe0815 I've resorted to using systemd to automatically restart the process when it uses too much memory. https://xkcd.com/1495/
 mybuntu-git2
commented
5 months ago
mybuntu-git2
commented
5 months ago I had the same issue using docker on ARM, used the same workaround (scan schedule disabled, scan via CLI, restart navidrome periodically) and the issue seems fixed in 0.50.1
deluan
commented
5 months ago Thanks @mybuntu-git2 for reporting back. I did some investigation a while ago and I think this is not really an issue with Navidrome, but how Go's Garbage Collector (GC) works. More info here:
Based on the info above, doesn't seem it is a memory leak, it is just the GC being "lazy" and leaving the work for when memory is actually needed. The information from the posts above indicates that the solution would be to limit the maximum amount of memory the Navidrome process "sees", so the GC would start reclaiming memory earlier and never going past the specified limit. I did some experimentation, but unfortunately I couldn't get to any conclusive results.
Now seems that in Go 1.21 (used in 0.50.1), some changes in the GC behaviour were introduced that could change how it affects long running applications like Navidrome.
If anyone experiencing this could validate the "memory leak" is gone, please let me know, so we can close this.
 mintsoft
commented
5 months ago
mintsoft
commented
5 months ago I'm using 0.50.1 and have the same sort of behaviour as a few others here.
Limited use instance, running in a container (LXC rather than docker), single user; RAM climes steadily and consistently up even when not being actively used. At approx 1.1GB I get alerts for the container and then restart the process and the cycle begins again.
mintsoft
commented
4 months ago I've just had to restart navidrome because it had gobbled up most of the RAM on the host again; I'm just testing it with the added Environmental variable GOMEMLIMIT=300000000; which should validate the comment here: https://github.com/navidrome/navidrome/issues/2003#issuecomment-1858885696
If basically it starts behaving better, then it's likely it's golang not returning the memory to the OS.
johndoe0815
commented
4 months ago @deluan
Unfortunately no improvement also with version 50.2. Last restart 21.12., no active usage from of Navidrome from an end users since then:
markasoftware
commented
4 months ago I've also been using Navidrome 0.50.2 since it was released and the memory issues continue. I run it in a cgroup with memory limited to 250 MiB, so this should definitely trigger Go's garbage collector. However it is not good enough, and my process OOMs and then restarts at least once per week.
 f-bn
commented
4 months ago
f-bn
commented
4 months ago From my knowledge, since memory limiting and reporting with Docker/LXC (or whatever container tech on Linux) is done using control groups, the memory usage is accounting cache usage of the container as part of memory used depending on the cgroup stat file, therefore not all the program using cgroup renders it the same way.
$ egrep "rss|cache" /sys/fs/cgroup/memory/docker/8de978f32abe0384869ef270cbb7e349bc40d7c430cd22f753c99411829e5090/memory.stat
cache 433336320 # 433MiB
rss 26042368 # 26MiB
rss_huge 0
total_cache 433336320
total_rss 26042368
total_rss_huge 0

$ cat /sys/fs/cgroup/memory/docker/8de978f32abe0384869ef270cbb7e349bc40d7c430cd22f753c99411829e5090/memory.usage_in_bytes
461443072 # 461 MiB

$ docker stats -a
...
8de978f32abe   navidrome      0.00%     163.7MiB / 4GiB       4.00%     0B / 0B   0B / 0B     0
So I don't think this is the ideal metrics to follow what's going on regarding memory usage for containers. The cache usage is obviously important since the program is reading files most of the time. On my side, everything looks stable on 0.50.2 even when doing full scans regarding Navidrome process memory usage (only my cache usage is going up to the container limit, here 4GB, but no OOM is triggered)
mintsoft
commented
4 months ago Just to clarify the situation for my test case vs the previous comment. Although I am putting navidrome within LXC, I am not using cgroups or applying any memory limit to the container itself. The actual host only has 4GB of RAM. So this is a more "real" test of the memory behaviour imo
mintsoft
commented
4 months ago Just started getting notifications again for 75% RAM on the host with GOMEMLIMIT set :(
● navidrome.service - Navidrome Music Server and Streamer compatible with Subsonic/Airsonic
     Loaded: loaded (/etc/systemd/system/navidrome.service; enabled; preset: enabled)
    Drop-In: /etc/systemd/system/navidrome.service.d
             └─override.conf
     Active: active (running) since Thu 2024-01-11 09:33:27 UTC; 1 week 3 days ago
   Main PID: 33592 (navidrome)
      Tasks: 12 (limit: 2302)
     Memory: 699.5M
        CPU: 3d 16h 52min 58.407s
     CGroup: /system.slice/navidrome.service
             └─33592 /opt/navidrome/navidrome --configfile /var/lib/navidrome/navidrome.toml
Took 10 days, to hit that limit.
htop:
And that was with this:
root@navidrome:/# systemctl show navidrome | grep Env
Environment=GOMEMLIMIT=300000000Reporting more details about my case, hoping this helps: Ubuntu 22.04 ARM (Odroid N2+) navidrome version 0.50.2
I run navidrome in docker, no alterations to gomemlimit.
with the following setup options relevant for memory usage (and Spotify and Lastfm set up, not included below)
> ND_SCANSCHEDULE: "@every 60m"
> ND_LOGLEVEL: error
> ND_SESSIONTIMEOUT: 30m
> ND_COVERARTPRIORITY: "external, embedded, cover.*, folder.*, front.*"
> ND_ENABLECOVERANIMATION: "false"
> ND_ENABLEMEDIAFILECOVERART: "false"
> ND_IMAGECACHESIZE: "0"
> ND_JUKEBOX_ENABLED: "false"
> ND_LISTENBRAINZ_ENABLED: "false"
> ND_SCANNER_GROUPALBUMRELEASES: "true"
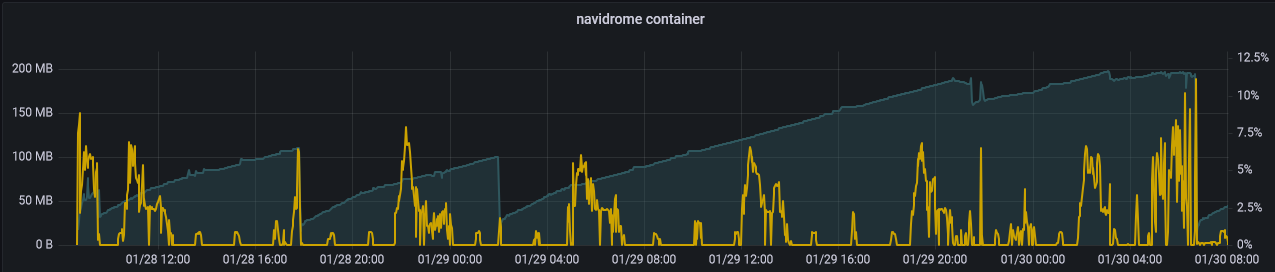
> ND_SCANNER_EXTRACTOR: "ffmpeg"Navidrome uses 23MB idle according to docker stats. Memory spikes to max 200MB when in use, and then is deallocated successfully. my system flushes caches in cron every few hours.
I have around 2K songs and two users.
mintsoft
commented
2 months ago Something I've just noticed (after restarting navidrome) ps vs systemd's understanding of the memory is different:
root@navidrome:/# systemctl status navidrome
● navidrome.service - Navidrome Music Server and Streamer compatible with Subsonic/Airsonic
     Loaded: loaded (/etc/systemd/system/navidrome.service; enabled; preset: enabled)
    Drop-In: /etc/systemd/system/navidrome.service.d
             └─override.conf
     Active: active (running) since Sun 2024-03-17 10:23:46 UTC; 4min 19s ago
   Main PID: 62333 (navidrome)
      Tasks: 12 (limit: 4640)
     Memory: 241.3M
        CPU: 36.030s
     CGroup: /system.slice/navidrome.service
             └─62333 /opt/navidrome/navidrome --configfile /var/lib/navidrome/navidrome.toml
vs
root@navidrome:/# ps aux | grep navidrome
USER         PID %CPU %MEM    VSZ   RSS TTY      STAT START   TIME COMMAND
navidro+ 62333 12.1 1.2 2086912 50012 ? Ssl 10:23 0:43 /opt/navidrome/navidrome --configfile /var/lib/navidrome/navidrome.tomlI've just built pprof into my local navidrome and I'll run it for a few weeks to see if this sheds any sort of light on the behaviour. If anyone else wants to do this, the easiest way I've found to enable pprof is through: https://github.com/mintsoft/navidrome/commit/04e6cd21c7a11c7a23647777b402616faf6ba7a7
deluan
commented
3 weeks ago I've just built pprof into my local navidrome and I'll run it for a few weeks to see if this sheds any sort of light on the behaviour. If anyone else wants to do this, the easiest way I've found to enable pprof is through: mintsoft@04e6cd2
Actually, the easiest way is to use the undocumented config option DevEnableProfiler=true: https://github.com/navidrome/navidrome/blob/7c5eec715ddeab36f3b5dc4a0d4db5beebffe9a0/cmd/root.go#L115-L117
I put it in place when I was investigating this issue, but couldn't find anything relevant. It is good to have more eyes on this, though. Thanks for taking a stab on it.
Description
I was checking my server system stats and was surprised by a really high RAM usage. So, I went to check what was going on, and saw a whooping 11.8GB usage by Navidrome. I went to check the Docker logs. It was not scanning (as far as I believe) and nobody was using it.
Expected Behaviour
Just consume the RAM that it always consume, restarting the container actually fixes the problem.
Steps to reproduce
Would love to be able to provide details, but it is a by the book installation. Currently its been up 47 days and has 429 songs.
Platform information
Additional information
The data from
docker stats: