nhsuk / nhsuk-service-manual-community-backlog

This is a place for digital teams in the NHS to work together and develop the NHS digital service manual.
https://service-manual.nhs.uk/community-and-contribution
62 stars 5 forks source link

Data: help users understand data (data visualisation, for example charts) #436

Open sarawilcox opened 2 years ago

sarawilcox commented 2 years ago

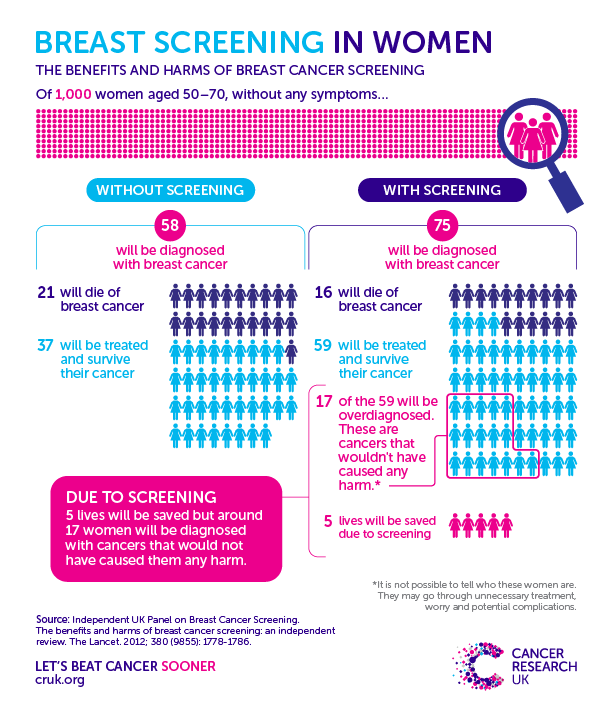
Some teams are looking at how we might help users understand health data or statistics, for example in bar charts or graphs.

Note, generally, we use statistics sparingly. See the content style guide on statistics.

The Office for National Statistics has some guidance on data visualisation: Presenting data: guidance for creating charts and tables and best practice for using colour in your work.

Also the Government Statistical Service has this guidance:

See also the GitHub issue for long descriptions of images.

sarawilcox commented 2 years ago

For complex text descriptions (too long for alt text), would we want to use long descriptions like the ones we recommend for skin symptoms images? https://service-manual.nhs.uk/content/inclusive-content/skin-symptoms#provide-a-long-description

erikaremyr commented 2 years ago

We've brought in 4 data visualisation elements into the redesign of the heart age tool (HAT). We took 2 from existing charts (BMI and blood pressure), and created 2 specifically for HAT (cholesterol and smoking). The primary reasons we brought them in were:

The smoking graph (showing how much someone's heart age could improve if they quit smoking) tested well with 6/6 participants. 1/6 participants did not understand the BMI graph (recreated from the BMI tool) and 2/6 participants found the blood pressure graph confusing. The cholesterol graph is based on the BMI graph and will need clinical input for the lower threshold + has not yet been tested with users.

Further work on the blood pressure and BMI tools will inform how we choose to visualise it in HAT.

Smoking graph

Screenshot 2022-05-10 at 16 18 05

BMI graph

Screenshot 2022-05-10 at 16 18 18

Cholesterol graph

Screenshot 2022-05-10 at 16 18 28

Blood pressure graph

Screenshot 2022-05-10 at 16 19 26
Tosin-Balogun commented 2 years ago

I wonder if other areas within NHS have done something dashboard related which they can share. I suspect those within screening and platforms might have

sarawilcox commented 2 years ago

An update to GOV.UK colours for charts: https://github.com/alphagov/govuk_publishing_components/pull/2782 to better meet colour contrast requirements.

May be of interest @erikaremyr @mcheung-nhs

mmips commented 1 year ago

@erikaremyr i'm wondering if you have considered using patterns, on top of colours and labels? references: https://accessibility.huit.harvard.edu/data-viz-charts-graphs http://www.ashleysheridan.co.uk/blog/Accessible+Graphs+and+Charts#patterns

sarawilcox commented 1 year ago

Accessibility and data visualisation

An intro to designing accessible data visualizations

vanessapereira-nhs commented 1 year ago

Latest graph from Tools team blood pressure tool

Screenshot 2022-11-25 at 14 14 23

This blood pressure graph was tested with users and the feedback was positive. It was clear that the graph supports the users' understanding of what their BP reading means. Users said that the colour coding makes it really clear to see where everything is. It also told us that the graph supports users' who have low digital and low health literacy skills understand what their BP readings would mean.

Tosin-Balogun commented 1 year ago

Latest graph from Tools team blood pressure tool

Screenshot 2022-11-25 at 14 14 23

This blood pressure graph was tested with users and the feedback was positive. It was clear that the graph supports the users' understanding of what their BP reading means. Users said that the colour coding makes it really clear to see where everything is. It also told us that the graph supports users' who have low digital and low health literacy skills understand what their BP readings would mean.

@vanessapereira-nhs

This looks brilliant! Our design system has not had much look into data visualisation in general, so this development is highly relevant.

Do you have a link to the prototype somewhere?

I also wondered, following on from @mmips comment about using patterns in addition to the colours. In some instances, users might not be able to use colour to differentiate the different parts of the graph, so the patterns would be the main focus for them (colour blindness). Perhaps trying different shapes for the patterns so the contrast is higher?

sarawilcox commented 1 year ago

See the Patient Information Forum's guidance on How to communicate benefits, risks and uncertainties.

sarawilcox commented 1 year ago

Cancer Research UK: graphic on benefits of breast cancer screening

Screenshot 2023-02-22 at 12 19 12

We don't tend to include this sort of detail re benefits and harms in NHS website content but some charities and hospital depts may do.

mmips commented 1 year ago

Cancer Research UK: graphic on benefits of breast cancer screening

Screenshot 2023-02-22 at 12 19 12

Thanks for posting @sarawilcox. It was referenced on the content design huddle last month as a good approach to communicating stats, making it easier for neurodivergent users to understand the statistics by emphasising impact, presenting data in a quite tangible way and working with numbers rather than just percentages.

sarawilcox commented 1 year ago

The red bar in the examples above has been used in the heart age tool UX+ redesign. It'll be included in the next design iteration of the tool that should be going out later this year. In testing, no user mentioned the red bar, either positively or negatively.

sarawilcox commented 1 year ago

Use of colour in the blood pressure chart above and users who are colour-blind

Screenshot 2023-03-08 at 16 48 11

sarawilcox commented 1 year ago

From the Tools team's work on the heart age tool.

Screenshot 2023-03-13 at 15 58 11

Asad-acc commented 1 year ago

Description: We are revamping the ratings and reviews journey for profiles and aiming to improve the star ratings used for reviews. The goal is to make the star ratings glanceable and provide more information compared to the current live star ratings. To achieve this, we are utilising ASCII star symbols, which allow for a leaner implementation and the ability to use gradients for decimal values in ratings. Currently, we are using the NHS yellow colour for the stars representing the actual user ratings, whilst employing a grey 2 colour for the remaining stars to show the scale. However, since yellow is used as a warning colour throughout the NHS, we aim to test with users whether yellow is suitable or if it should be changed to another colour such as blue, without giving the impression that the stars are hyperlinks as that is the typical colour for clickable items in the NHS.

Design Thinking:

Screenshot 2023-08-14 at 12 19 38@2x
Asad-acc commented 1 year ago

Description: We have designed a widget for the Care Quality Commission (CQC), which has been positively received by users. The widget incorporates the colours, terminology, and iconography specified by the CQC, providing limited flexibility in these aspects. Therefore, the "outstanding" icon, as well as the colours used, may differ from the NHS service manual.

Design Thinking:

Screenshot 2023-08-14 at 12 22 19@2x
sarawilcox commented 1 year ago

Thanks @Asad-acc. It's helpful to have this noted here. I have also now set up a separate issue for Star ratings and 5-point scales. I've linked to your comments there.

vanessapereira-nhs commented 11 months ago

My team is working on the redesign of the BMI tool, and we changed the current live chart a bit to make sure we followed the guides from what we already did for the Blood Pressure tool (see above the image Sara Wilcox shared).

Main differences from the live version . The current live tool thresholds only go up to a BMI of around 32, while on the redesigned version we go up until a BMI of 39.9 (for white people) or 37.4 (for people from ethnic minority groups) which represents the maximum level of obese 2 for both. . Colors are matching the Blood Pressure tool (BP) and are accessible (see comments above). . We have a label box, just like we do for BP. . We have a chart description to help users read the chart if needed.

Some insights from usability and multivariate testing We tested this chart against another one we were proposing and this performed really well. Users easily understood it and could identify the category they landed without any issues.

-- Screenshot of the redesigned chart:

Screenshot 2023-10-19 at 16 07 27
maevewillie-pepple commented 9 months ago

My team is working on a 'indicator range bar' for test results

What

Journeys used on Test results in the NHS App (to be released)

Some insights from usability testing

Screenshots of the design

Screenshot 2023-12-15 at 12 03 32 Screenshot 2023-12-15 at 12 04 02
Ahnji1 commented 3 months ago

My team is working on Child BMI and there is a bar chart on the top of the result page. We referenced the bar chart from the adult BMI tool to maintain the consistency, but to improve user experience and clarity, there are some changes.

1. Excluded the red colour on the chart

Problem: The 'very overweight' category and the use of red were too strong and potentially alarming, especially given the sensitivity around children's weight. Solution: We removed the 'very overweight' category, leaving three categories: underweight, healthy weight, and overweight. The red color was excluded, and 'overweight' was marked with yellow to reduce the visual impact.

2. Enhanced result clarity with arrow indicator and by writing the number:

Problem: Users found it difficult to pinpoint their exact result on the bar chart, took some time to understand the chart. Solution: We removed the 'x' mark on the line bar and added an arrow above the bar chart with a line crossing down the chart, displaying the centile number. This make the result in the bar chart clearer.

3. Coloured line bar in result summary

Problem: Users struggled to understand their results immediately during the user testing. One of the reason was the not clear language but visual could help the interpretation. Solution: We added a colored line bar next to the result summary that matches the category colour from the bar chart. This visual cue draws users' attention to the top of the page and creates a seamless connection between the summary and the chart, facilitating quicker and easier result interpretation.

Screenshot 2024-05-30 at 11 31 20