 Tea-NT
commented
6 years ago
Tea-NT
commented
6 years ago I installed .NET Framework 4.7.2 to solved the question, I think add the .NET Framework minimum version request in README.md file is batter. and thanks for your opensource code.
I google this page: System.MissingMethodException Int32 System.Environment. get_CurrentManagedThreadId() so i download the newest .NET Framework to try.it works.
 nickbabcock
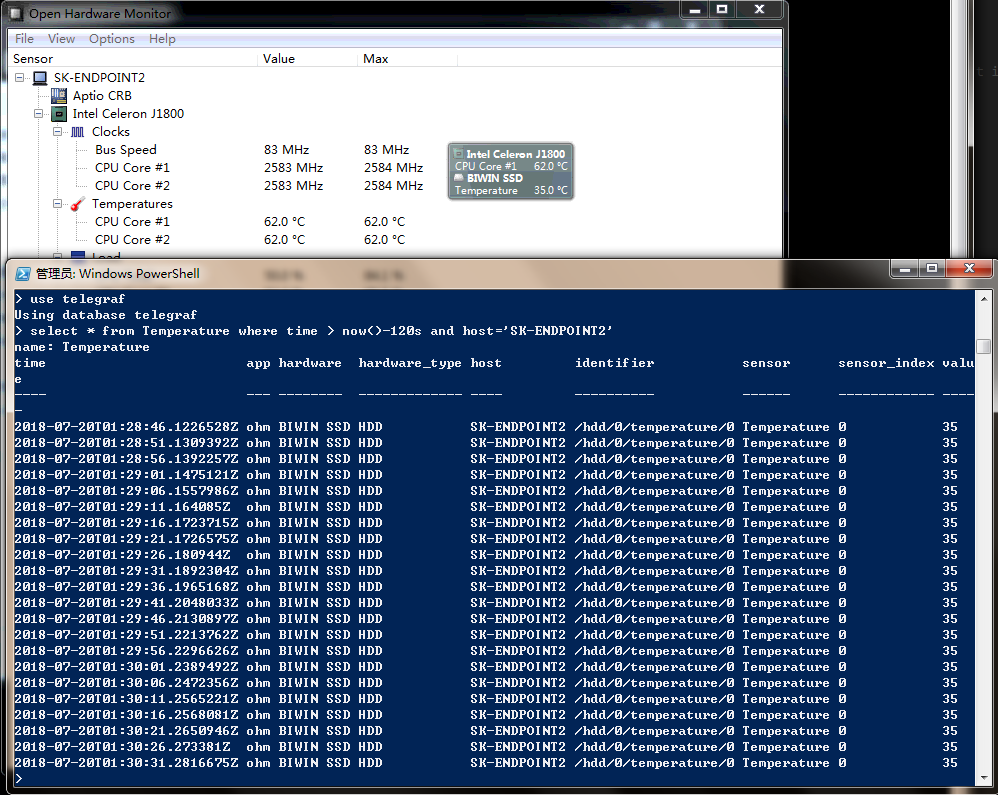 I want to try remote debugging to find out the reason,but there is not Remote debug checkbox in OhmGraphite project's Properties --Debug page with VS2017 .I am confused.
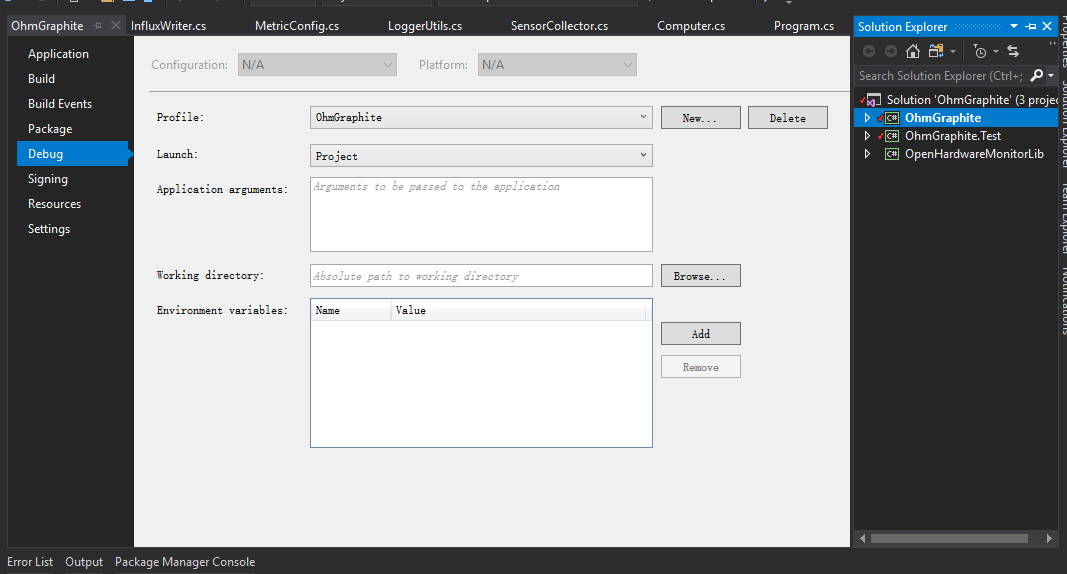


 Left pic is only start OhmGraphite,right is start OhmGraphite after ohm startup.
Here is exception info:
I tryed
OhmGraphite.exe start,OhmGraphite.exe runandOhmGraphite.exe install,all of them was not work. The OhmGraphite.exe work well in x64 Win7