 mwaskom
commented
4 years ago
mwaskom
commented
4 years ago Based on this image, I don't understand why the medial wall isn't transparent?
I think this is because you are setting medial wall values to -1, when I think you want 0.
Based on this image, I don't understand why: positive values are thresholded at thresh_low = 0.1 but negative values are not shown
The thresh argument doesn't interact with center the way min and max does, it just thresholds out all values lower than it. But I don't think you need it if you're using center, min, and transparent.
the colormap of values > 0.1 doesn't look good and colorscale bar isn't updated with values from 0.1 to 0.534 for positive values and -0.1 to -0.534 for negative values
I'm not sure what you mean by "doesn't look good".
 mattvan83

 larsoner
Hi,
I used on OSX
pysurfer=0.11.dev0withpython=3.6.10and tried to display on Desikan parcellation values, containing both negative and positives values, using the following code:And got the following result: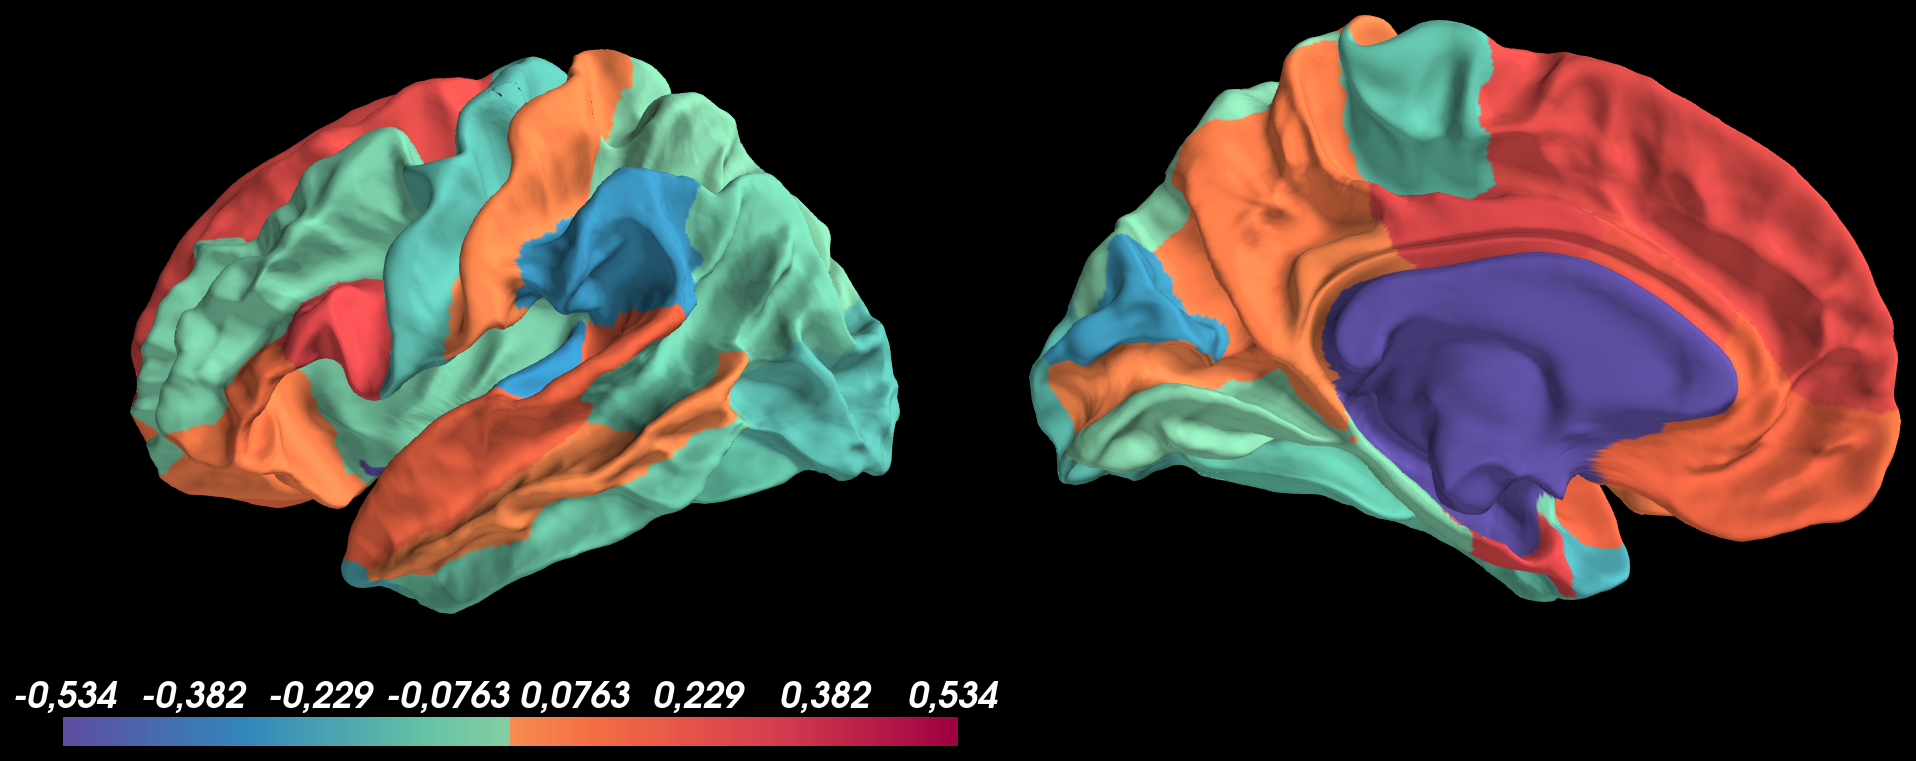
Based on this image, I don't understand why the medial wall isn't transparent?
Secondly, I tried to threshold both negative and positive values at
thresh_low = 0.1using pretty same code as before with thethreshoption ofadd_data:And got the following result: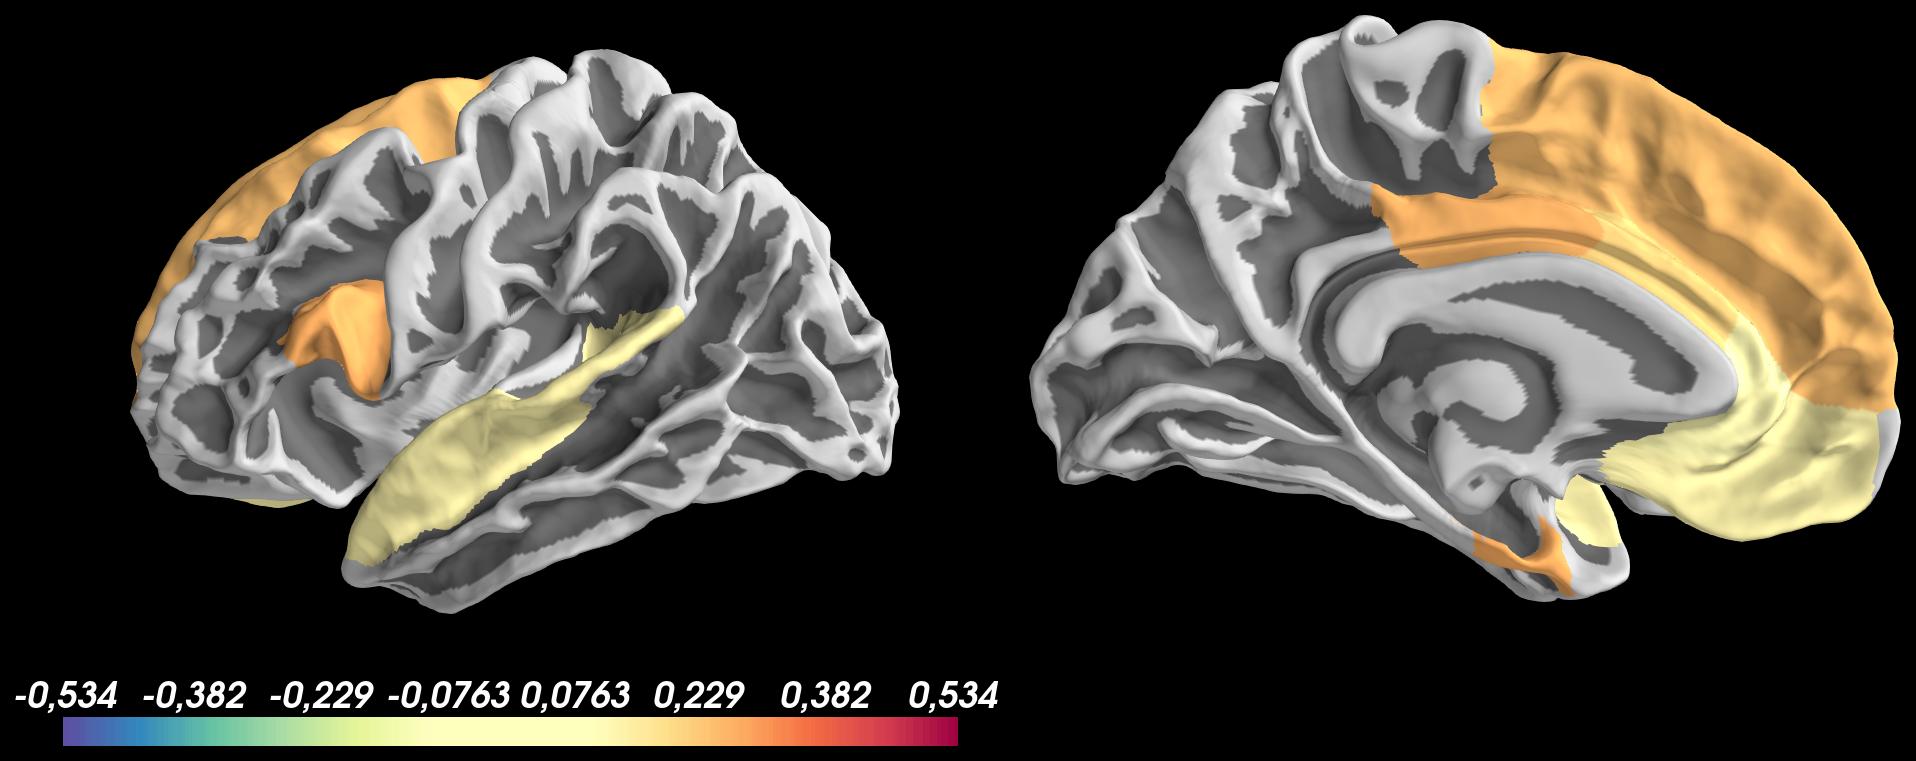
Based on this image, I don't understand why: 1) positive values are thresholded at
thresh_low = 0.1but negative values are not shown 2) the colormap of values > 0.1 doesn't look good and colorscale bar isn't updated with values from0.1 to 0.534for positive values and-0.1 to -0.534for negative values