 chrisgorgo
commented
5 years ago
chrisgorgo
commented
5 years ago Sounds reasonable. By "Patch" you mean replace?
On Tue, Nov 13, 2018 at 10:42 AM Oscar Esteban notifications@github.com wrote:
Summary
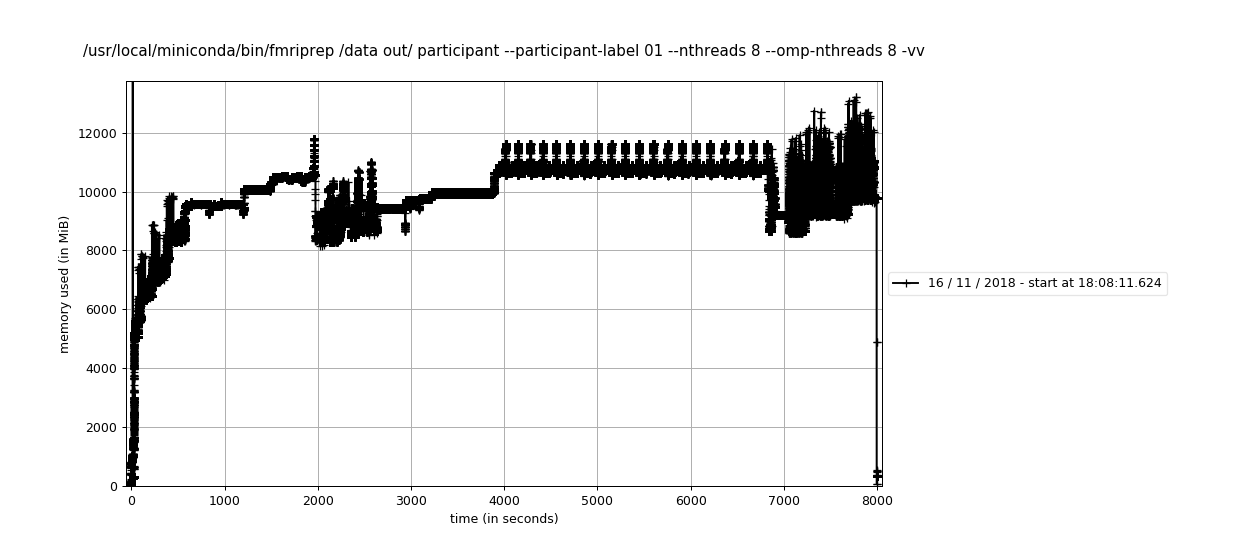
Large workflows are prone to get killed by the OOM Killer in linux and similar devices in other systems. The common denominator is that the RSS memory fingerprint is sensible, not too big, but the VM skyrockets when the workflow has many nodes. Actual behavior
Except for pure python interfaces, all nipype interfaces fork new processes via subprocess.Popen. That way, all new processes are started using fork and allocate for twice as much virtual memory as it is allocated before forking. This, in addition with python inefficiency to garbage collect after finishing the process, leads to overcommitting memory (and processes being killed on systems that would not allow that). Expected behavior
Less memory consumption How to replicate the behavior
Run fmriprep on a large dataset, disallowing overcommitting and with a low memory limit (e.g. 8GB) Idea:
Patch subprocess.Popen with multiprocessing.context.Popen. Doing that, in theory, all these processes should be forked on the server process (which should have a constant, small memory fingerprint).
WDYT @satra https://github.com/satra @effigies https://github.com/effigies @chrisfilo https://github.com/chrisfilo ?
BTW, this solution might be only possible with Python>=3.4. As per https://docs.python.org/3/library/multiprocessing.html#contexts-and-start-methods :
Changed in version 3.4: spawn added on all unix platforms, and forkserver added for some unix platforms. Child processes no longer inherit all of the parents inheritable handles on Windows.
— You are receiving this because you were mentioned. Reply to this email directly, view it on GitHub https://github.com/nipy/nipype/issues/2776, or mute the thread https://github.com/notifications/unsubscribe-auth/AAOkp9S8tpPqYViC3P9VhnlIZXQw_j4lks5uuxJ6gaJpZM4YcRYq .
 effigies
 satra
satra oesteban


Summary
Large workflows are prone to get killed by the OOM Killer in linux and similar devices in other systems. The common denominator is that the RSS memory fingerprint is sensible, not too big, but the VM skyrockets when the workflow has many nodes.
Actual behavior
Except for pure python interfaces, all nipype interfaces fork new processes via
subprocess.Popen. That way, all new processes are started usingforkand allocate for twice as much virtual memory as it is allocated before forking. This, in addition with python inefficiency to garbage collect after finishing the process, leads to overcommitting memory (and processes being killed on systems that would not allow that).Expected behavior
Less memory consumption
How to replicate the behavior
Run fmriprep on a large dataset, disallowing overcommitting and with a low memory limit (e.g. 8GB)
Idea:
Patch
subprocess.Popenwithmultiprocessing.context.Popen. Doing that, in theory, all these processes should be forked on the server process (which should have a constant, small memory fingerprint).WDYT @satra @effigies @chrisfilo ?
BTW, this solution might be only possible with Python>=3.4. As per https://docs.python.org/3/library/multiprocessing.html#contexts-and-start-methods: