 ldcsaa
commented
1 year ago
ldcsaa
commented
1 year ago 那 service 的 pod 实例如何监控呢?
Open nodejh opened 2 years ago
ldcsaa
commented
1 year ago 那 service 的 pod 实例如何监控呢?
 tsejx
commented
1 year ago
tsejx
commented
1 year ago 你发给我的邮件已经收到了~辛苦了~
 nodejh
commented
1 year ago
nodejh
commented
1 year ago @ldcsaa k8s 内置了 cAdvisor 用于采集集群中 Pod 相关的性能指标,这些指标可以直接使用,另外也可以使用 node-exporter 采集机器的指标。然后在 Prometheus 中去抓取 /metric 接口的数据就可以了。
本文主要侧重于 Spring Boot 应用相关的监控,比如应用的负载、JVM 指标等,这些指标需要自己采集,本文则描述了如何采集这些指标。
不管什么指标,采集后用 Prometheus 统一抓取数据,再用 Grafana 展示数据就好了。
背景
本文主要介绍如何使用 Prometheus 和 Grafana 可视化监控运行在 k8s 上的 Spring Boot 应用,监控指标包括 CPU、内存、线程信息、日志信息、HTTP 请求、JVM 等。
技术方案
技术方案如下图所示: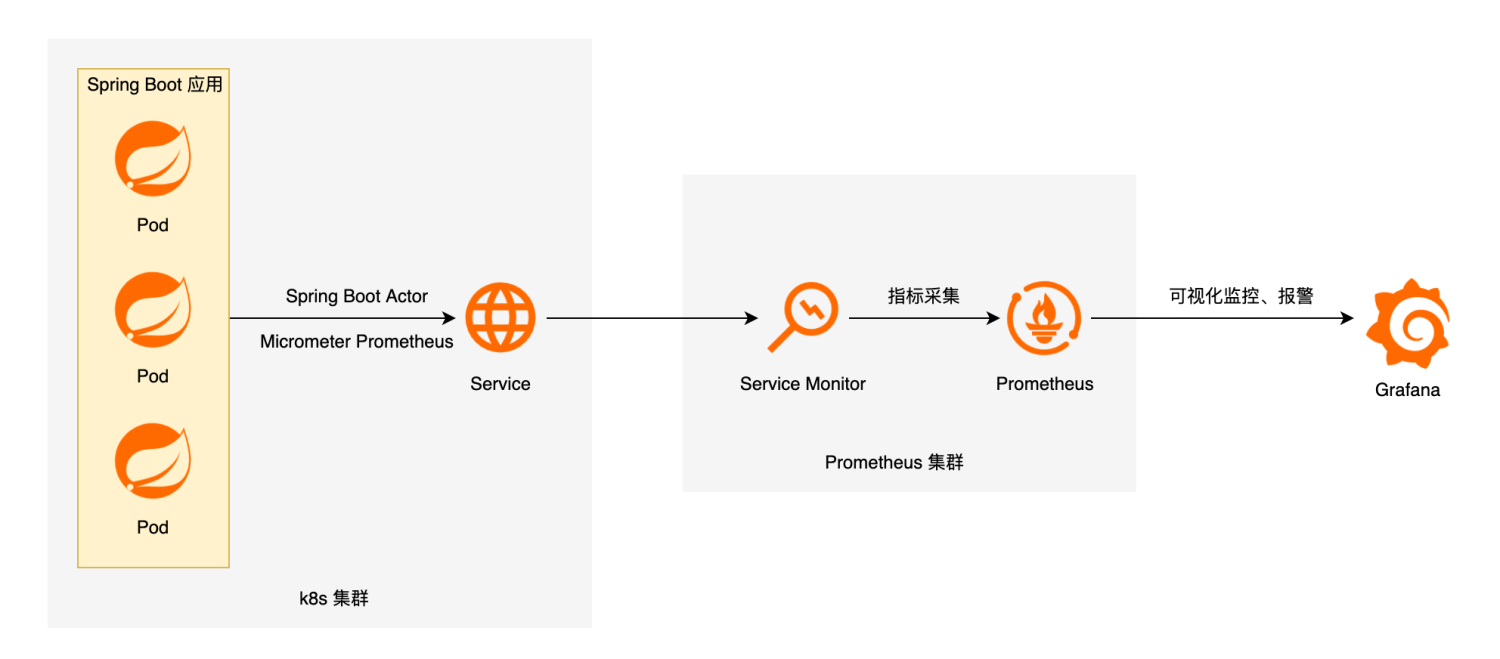
首先我们需要在 Spring Boot 应用中使用 Spring Boot Actuator 监控应用、暴露指标,并使用 Micrometer Prometheus 将 Actuator 监控指标转换为 Prometheus 格式。
Micrometer 为 Java 平台上的性能数据收集提供了一个通用的 API,类似于 SLF4J ,只不过它关注的不是Logging(日志),而是application metrics(应用指标)。 简而言之,它就是应用监控界的SLF4J。
然后在 k8s 集群中,我们需要通过 Service 对外提供 Spring Boot 应用的指标接口。
Prometheus 是一个开源系统监控和警报工具包,可以采集监控指标,并存储为时间序列数据,Prometheus 还提供了灵活的查询语言 PromQL 来查询数据。Prometheus 通过拉模型采集指标,所以我们需要在 Prometheus 集群中配置服务发现(ServiceMonitor)来定期从应用中抓取指标。
Grafana 是一个开源的可视化分析平台,可以用它创建监控仪表盘、配置告警等。
整体个配置流程如下:
部署应用
应用配置
在
pom.xml中添加如下配置:
然后修改
application.yaml中添加 Spring Boot Actuator 相关配置:
至此,应用配置就完成了,可以通过
/actuator/prometheus接口查看配置是否正确:
返回结果如下所示:
配置 Service
因为应用是部署在 k8s 上的,由多个 Pod 组成,所以还需要为 Pod 添加 Service,对外提供 HTTP 服务,这样 Prometheus 才可以抓取监控指标。
在 k8s 中添加类似下面的 Service:
需要注意
spec.selector需要与 Pod 的标签对应。例如使用 Deployment 部署应用,则需要与 Deployment 的spec.template.metadata.labels对应,这样 Service 才能知道对应的 Pod。配置服务发现
如果使用的是自己部署的 Prometheus 服务,则可以在
prometheus.yml中添加上 Service 对应的任务,例如: 如果使用的是云厂商提供的 Prometheus 服务,则需要安装云厂商的规则添加服务发现。如 阿里云 Prometheus 监控 的 ServiceMonitor 配置如下:
需要注意的是,
spec.selector.matchLabels需要与应用 Service 中的spec.ports[].name对应。配置大盘
Grafana 提供了丰富的大盘模板,可以在其官网搜索合适的大盘导入到自己的 Grafana 监控中。
我使用的是这两个大盘:
最终效果预览如下:
总结
至此,基于 Prometheus + Grafana 的 Spring Boot 应用监控系统就创建完成了。接下来还可以使用 Grafana 实现告警,这类就不赘述了。