 hydrosquall
commented
3 years ago
hydrosquall
commented
3 years ago Hi @xhxh96 ,
I think what you're looking for is the setting the edgeType property to a function that returns JSX, instead of passing in a custom path string directly: https://semiotic.nteract.io/api/networkframe#edgetype--string--object--function-
Inside your function, you get a reference to EdgeData, which should have all the information you need to create the custom edge
For example:
{
     //.. your other network graph configuration data
     edgeType: (edgeData) => {
        // Suggest console.log(d) here to check what data you have access to
        const myCustomPath = yourCustomRightAngledEdgesFunction(edgeData);
        return  <path d={myCustomPath} />
    }
 }
}
Hope this helps!
 emeeks
I'm trying to render a hierarchical clustering diagram that looks something like this (minus the similarity axis and dashed-line) with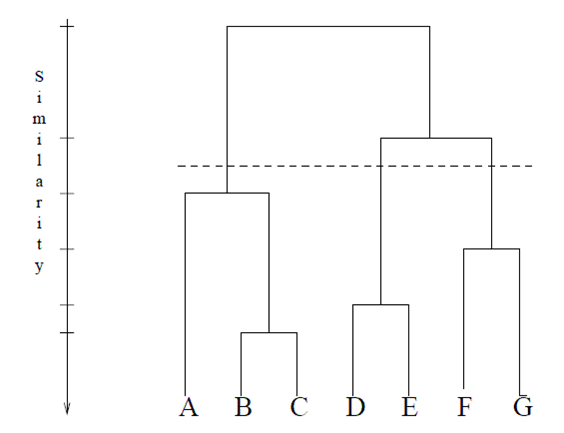
NetworkFrame.However, I haven't been able to figure out how I can configure the edges to produce a diagram that's like the above. This is what was generated with
NetworkFramewithclusteras itsnetworkType:I understood from this post that this can be done in d3 by changing the attribute of
<path>. I tried changingedgeTypebut it didn't work -- I used the example in the doc and the edges simply didn't show up.