 JasonYapzx
commented
1 year ago
JasonYapzx
commented
1 year ago Team's Response
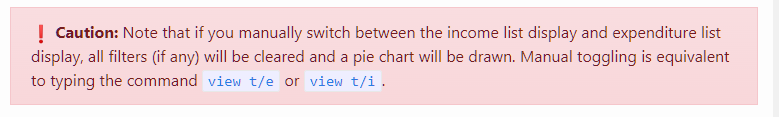
Reason: Toggling manually using the Expenditure and Income tabs is the same as clearing any filters applied to the list, and it will default to show a PieChart view. Hence, this is an expected behaviour.
Duplicate status (if any):
--
I am a little confused when it displays a line graph and when it displays a pie chart. Seems quite random at times. In the UG it is shown that for expenses, when i type summary, it will show a pie chart, but it seems to display a graph instead.
It seems like a behavior shown depending on which page I am currently on. If i am on the expenses page and i call the command, the expenses portion will turn into a line graph, while the income portion is a pie chart. If i am on the income page and call the command, the income portion is a line graph and expenses is a pie chart.
Either way it is a different behavior expected or not specifically mentioned in the UG.
[original: nus-cs2103-AY2223S1/pe-interim#1140] [original labels: type.FunctionalityBug severity.Low]