ocean-eddy-cpt / gcm-filters

Diffusion-based Spatial Filtering of Gridded Data
https://gcm-filters.readthedocs.io/
Other
37 stars 24 forks source link

[BUG] Seam appears when applying Laplacians to POP data #148

Closed paigem closed 2 years ago

paigem commented 2 years ago

What happened: A seam (unphysical line in the ocean) appears in my filtered field after applying a Laplacian to the POP data. The seam appears to come from the area input coordinate (see below).

What you expected to happen: I do not expect this seam to appear, just as it does not appear in the original (unfiltered) data. I expect GCM-filters to be able to handle the grid seam such that it does not show up in the final filtered field .

Minimal Complete Verifiable Example (MCVE):

import gcm_filters
import xarray as xr
import intake

# Load POP data
cat = intake.open_catalog("https://raw.githubusercontent.com/pangeo-data/pangeo-datastore/master/intake-catalogs/ocean/CESM_POP.yaml")
ds = cat['CESM_POP_hires_control'].to_dask()

# Get required input variables
gcm_filters.required_grid_vars(gcm_filters.GridType.TRIPOLAR_REGULAR_WITH_LAND_AREA_WEIGHTED)

# Define inputs
wet_mask = xr.where(ds['KMT']>0, 1, 0)
area = ds.TAREA  # in cm^2

sst = ds.SST.where(wet_mask)
sst = sst.isel(time=slice(0,1)) # only filter one timestep

# Define input specs
specs = {
    'filter_scale': 10,
    'dx_min': 1,
    'filter_shape': gcm_filters.FilterShape.GAUSSIAN,
    'grid_type': gcm_filters.GridType.TRIPOLAR_REGULAR_WITH_LAND_AREA_WEIGHTED
}

# Compute filter
filter_sst = gcm_filters.Filter(grid_vars={'area': area, 'wet_mask': wet_mask}, **specs)

# Apply filter to data
filtered_sst = filter_sst.apply(sst, dims=['nlat', 'nlon']).compute()

filtered_sst.plot()

The above code yields the following figure of the filtered SST field: image

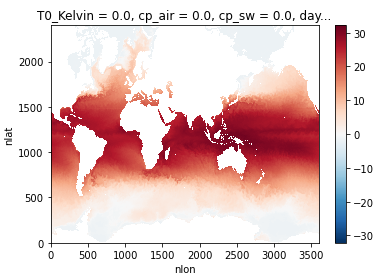
It's not immediately apparent when viewing the entire dataset, but if we zoom into the problem latitude, the seam is apparent:

filtered_sst.isel(nlat=slice(1450,1510)).plot(figsize=(12,1))

image

The seam likely arises due to the grid of this POP dataset, which can be seen in the area input coordinate:

ds.TAREA.plot()

image

Anything else we need to know?:

I have also had the same behavior running other Laplacians: TRIPOLAR_POP_WITH_LAND and REGULAR_WITH_LAND_AREA_WEIGHTED.

GCM-Filters version and environment:

version: 0.1.4.dev132+g0fb2314 Pangeo Cloud environment
rabernat commented 2 years ago

To me it makes sense that this discontinuity would appear when using the "REGULAR" filters which don't account for the spatially variable grid cell geometry. However, I am troubled that TRIPOLAR_POP_WITH_LAND also produces the same discontinuity. Are you sure about that?

NoraLoose commented 2 years ago

Thanks for opening this issue, Paige! I agree the problem arises from the area input data. The POP grid cell area has a discontinuity at low latitudes (as your final plot shows) - I have noticed this before too, it's super weird.

The problem that you are seeing would arise for every Laplacian that needs the grid cell area as an input (these are all except the non-area-weighted REGULAR Laplacians). A discontinuity in area will propagate into the filtered field because the filtered field is created by adding updates to the original field, where the updates are computed via the Laplacian operator (see Section "Filter Steps" here).

Conclusion: I guess our filter package expects continuous (smooth?) input data. Question: Any ideas for how we could accommodate the weird POP grid? @iangrooms?

I wonder how the POP model deals with the area discontinuity in their online computation of diffusion etc.

paigem commented 2 years ago

False alarm! Sorry @rabernat @NoraLoose - I had a typo when I ran the code for the TRIPOLAR_POP_WITH_LAND, but have now rerun it and can see that the seam does NOT appear with that Laplacian. See code below to verify that the seam is gone.

In summary, the seam does appear for the REGULAR Laplacian types, as it assumes a regular grid (and as @rabernat said above, does not account for the spatially varying grid geometry), but does not appear in the TRIPOLAR_POP_WITH_LAND. My understanding is thus that I can currently apply a fixed length filter to my POP dataset globally (using TRIPOLAR_POP_WITH_LAND), but not a fixed factor filter (which uses a REGULAR Laplacian as in this documentation example).

I will close this issue now since it's not a bug after all. Thanks for your comments @rabernat and @NoraLoose.

import gcm_filters
import xarray as xr
import intake

# Load POP data
cat = intake.open_catalog("https://raw.githubusercontent.com/pangeo-data/pangeo-datastore/master/intake-catalogs/ocean/CESM_POP.yaml")
ds = cat['CESM_POP_hires_control'].to_dask()

# Get required input variables
gcm_filters.required_grid_vars(gcm_filters.GridType.TRIPOLAR_POP_WITH_LAND)

# Define inputs
wet_mask = xr.where(ds['KMT']>0, 1, 0)
area = ds.TAREA  # in cm^2
dxe = ds.HUS  # x-spacing centered at eastern T-cell edge in cm
dye = ds.HTE  # y-spacing centered at eastern T-cell edge in cm
dxn = ds.HTN  # x-spacing centered at northern T-cell edge in cm
dyn = ds.HUW  # y-spacing centered at northern T-cell edge in cm
dx_min_POP = min(dxe.where(wet_mask).min(), dye.where(wet_mask).min(), dxn.where(wet_mask).min(), dyn.where(wet_mask).min())
dx_min_POP = dx_min_POP.values

sst = ds.SST.where(wet_mask)
sst = sst.isel(time=slice(0,1)) # only filter one timestep

# Define input specs
specs = {
    'filter_scale': 10000000,
    'filter_shape': gcm_filters.FilterShape.GAUSSIAN,
    'dx_min': dx_min_POP
}

# Compute filter
filter_tripolar_pop_with_land = gcm_filters.Filter(
    **specs,
    grid_type=gcm_filters.GridType.TRIPOLAR_POP_WITH_LAND,
    grid_vars={
        'wet_mask': wet_mask, 
        'dxe': dxe, 'dye': dye, 'dxn': dxn, 'dyn': dyn, 'tarea': area
    }
)
filter_tripolar_pop_with_land

# Apply filter to data
filtered_sst = filter_tripolar_pop_with_land.apply(sst, dims=['nlat', 'nlon']).compute()

filtered_sst.isel(nlat=slice(1450,1510)).plot(figsize=(12,1))

image

iangrooms commented 2 years ago

One could get a fixed factor filter if we had an anisotropic Laplacian on the POP tripole grid. POP does have anisotropic scalar and vector Laplacians implemented in Fortran, so in principle it's possible, but would require porting another Laplacian kernel in Python.

paigem commented 2 years ago

Agreed @iangrooms! I think that the first version of my B-grid vector Laplacian code had some lines of code for the anisotropic Laplacian, so that could be a starting point for someone who wants to implement the anisotropic vector Laplacian for POP.