ocean-transport / coiled_collaboration

Repository to track and link issues across other repositories, which are relevant to the Abernathey Lab and Coiled
0 stars 0 forks source link

Scaling issues with large datasets #3

Open jbusecke opened 3 years ago

jbusecke commented 3 years ago

In this issue I am trying to come up with a somewhat 'canonical' example of a workflow that I keep having trouble with when working on large climate model data.

A typical workflow for ocean model data

At the very basic level most of (at least my) workflows can be broken down into three steps.

  1. Read in data
  2. Apply some processing (this can be very basic to more advanced steps)
  3. Save the results out

Many of the problems I have encountered in the past are certainly related to more complex processing steps (2.) but I find that most of the time there is nothing that inherently breaks the processing, rather it seems that dask is just blowing up the available memory by starting to work on too many tasks at once if the dataset reaches a certain size.

I came up with this example, using xarray+dask, which hopefully illustrates my problem:

Working in the pangeo cloud deployment on a 'large' server, I first set up a dask gateway cluster and the pangeo scratch bucket:

# Set up scratch bucket path
import os
PANGEO_SCRATCH = os.environ['PANGEO_SCRATCH']
# -> gs://pangeo-scratch/<username>
import fsspec
mapper = fsspec.get_mapper(f'{PANGEO_SCRATCH}/test/test.zarr')
# mapper can now be to read / write zarr stores

from dask_gateway import GatewayCluster

cluster = GatewayCluster()
cluster.adapt(minimum=6, maximum=20)  # or  to a fixed size.
client = cluster.get_client()

Then I create a very simple synthetic dataset

# Lets first create a simple dummy dataset
import dask.array as dsa
import xarray as xr
nt = 600 # this works super smoothly

so = xr.DataArray(dsa.random.random(size=(1440, 1080, 35, nt), chunks=(1440, 270, 35, 1)), dims=['x', 'y', 'z', 'time'])
thetao = xr.DataArray(dsa.random.random(size=(1440, 1080, 35, nt), chunks=(1440, 270, 35, 1)), dims=['x', 'y', 'z', 'time'])

ds = xr.Dataset({'so':so, 'thetao':thetao})
ds

And just save it out to the pangeo cloud scratch bucket.

%time ds.to_zarr(mapper, mode='w')
CPU times: user 21.4 s, sys: 2.44 s, total: 23.8 s
Wall time: 15min 55s

This works as I would expect, showing low memory usage and a dense task graph: image
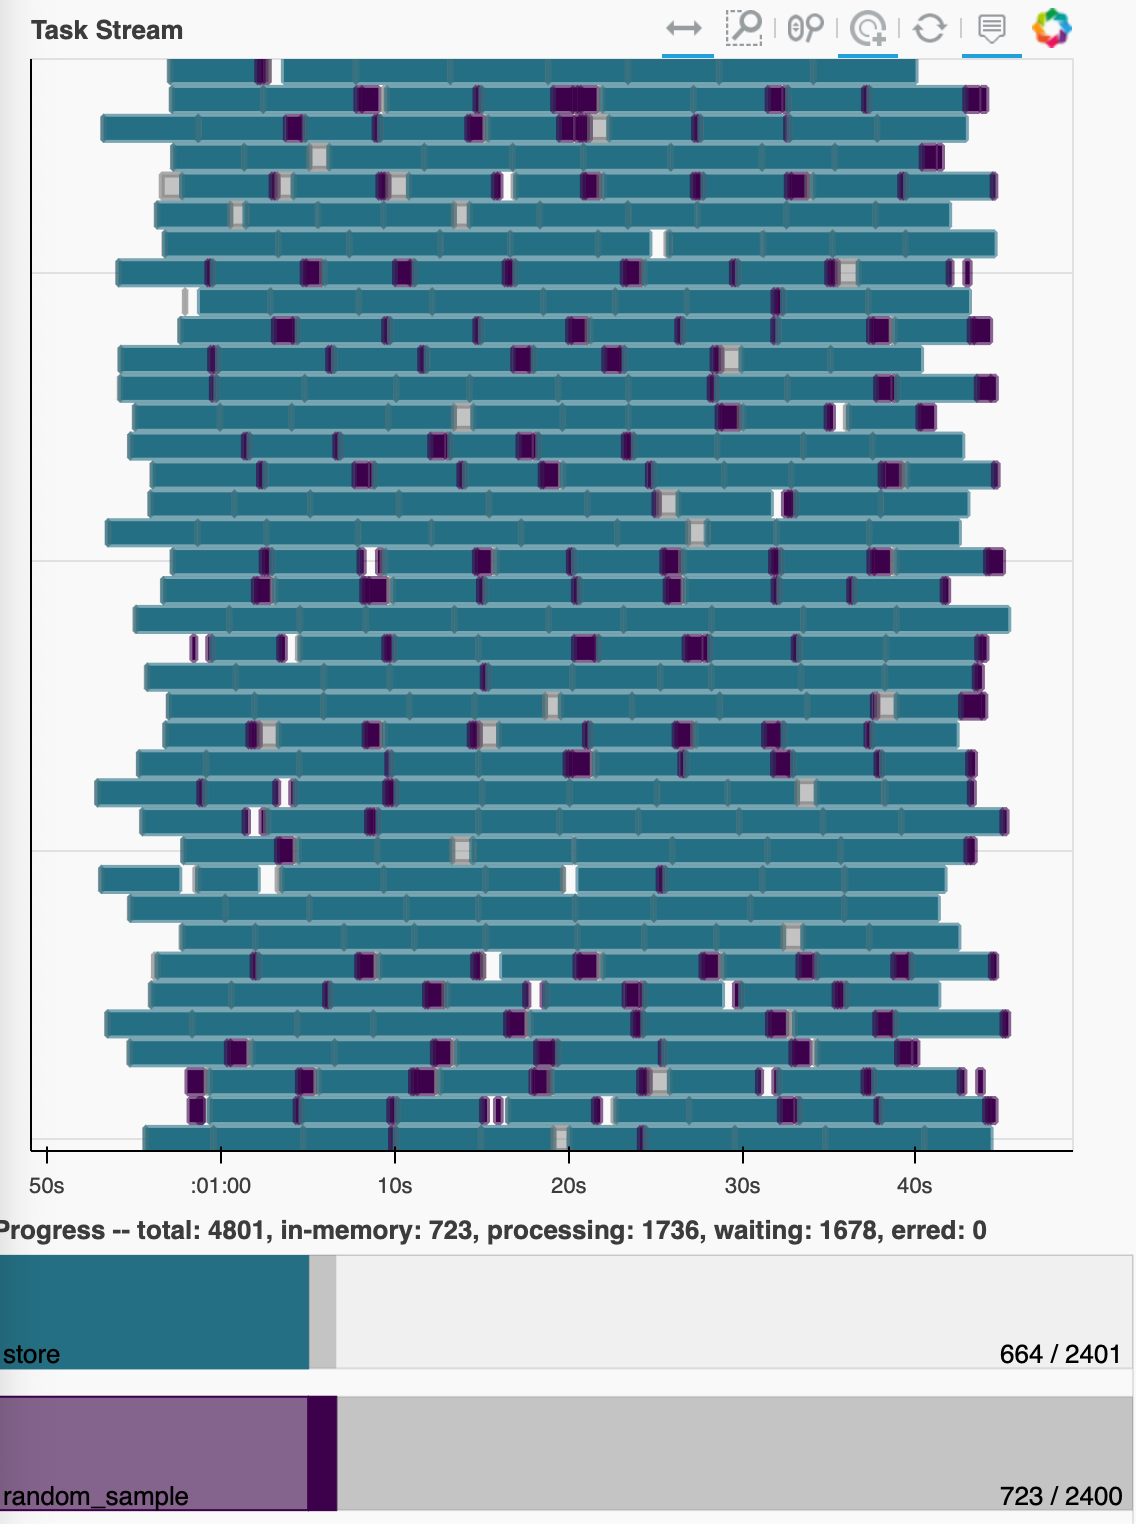
If this scales properly I would expect a dataset that is chunked the same way, just has more chunks along the time dimension to process in the same smooth way (with execution time proportional to the increase along the time axis). But when I simply double the time chunks

nt = 1200

so = xr.DataArray(dsa.random.random(size=(1440, 1080, 35, nt), chunks=(360, 360, 35, 1)), dims=['x', 'y', 'z', 'time'])
thetao = xr.DataArray(dsa.random.random(size=(1440, 1080, 35, nt), chunks=(360, 360, 35, 1)), dims=['x', 'y', 'z', 'time'])

ds = xr.Dataset({'so':so, 'thetao':thetao})
ds

I start seeing very high memory load and buffering to disk? (not actually sure where these dask workers are writing their temp data to): image
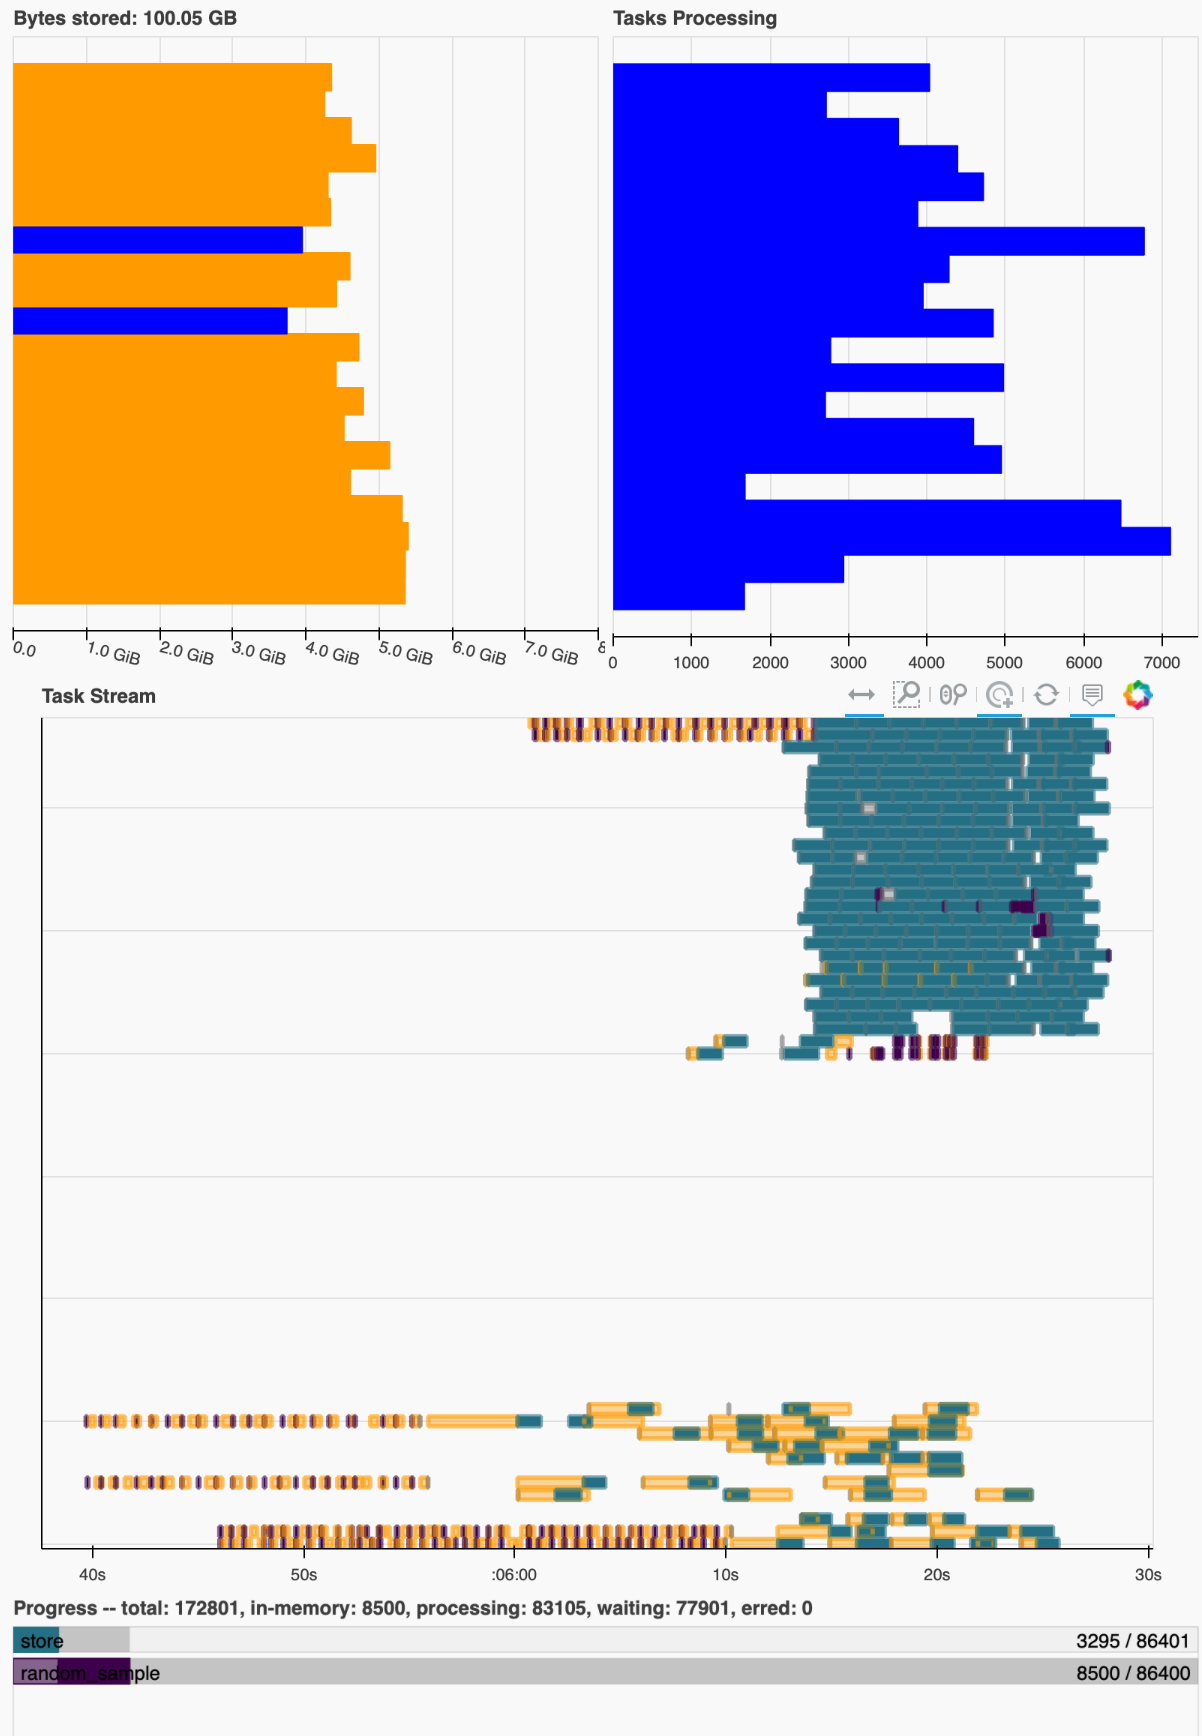
The task graph seems to recover periodically and then go back into a situation like this and the timing suggests that this does take approximately double as long as the previous dataset.

Note that I am not very confident about timings here, due to the adaptive cluster and especially the issue described in #2, which seems to vary quite a bit between executions)

it gets worse when I add even more time chunks, to the point where the computation crashes out some times. As mentioned in #2, it is not uncommon to work with such large datasets, e.g. multi centuries-long control runs.

To put this in perspective, dealing with issues like this, and coming up with everchanging 'ugly' solutions like looping over smaller time slices, etc, has taken up a considerable amount of my work hours in the past months/years. A solution to this would be an absolute godsend to my scientific productivity.

I have had some success with manually throttling my dask workers on HPC clusters (e.g. reducing the number of workers on a node, and thus allocating very large amounts of memory to each), but I have the feeling (and I might be completely wrong and naive) that there should be a way to 'limit' the number of tasks that are started (maybe along a custom dimension which could be determined by e.g. xarray)?

I would certainly be willing to sacrifice speed for reliability (in this case reliability=less probability that the whole cluster dies because the workers run out of memory). Also note that this example is the absolute simplest way to work with a model dataset, which does not even involve applying any processing steps. The addition of masking, coordinate transformation and other things highly amplifies this problem.

I am more than happy to do further testing, and please correct any of my vocabulary or assumptions above, as I am sure I have some of these things wrong.

P.S.: I know there was a discussion about adding the concept of 'memory pressure' started by @rabernat I believe, but I cannot find it at the moment.

jbusecke commented 3 years ago

From some of the initial interactions in #2 I got curious and started reading into the 'Optimization' chapter of the desk docs. I think not being able to diagnose/understand what is going on on that level really prevents me from identifying problems in a more concise manner.

I would like to learn more how I can inspect the task graph. I was able to go through the docs and I think I understand the steps on a basic level, but on a practical level I am not quite sure how to expose the graph from within an array dataset. Given the example above, how do I get to the dask graph leading to a final chunk?

I have tried

da = ds.simple.isel(time=0, x=0, y=0).data
dict(da.dask)

but I think that still gives me the full dask graph for the entire array (its a huuuge dict)? If I try to .visualize() it, the output is not useable. Could I apply cull to this to see just the tasks leading to my selection or am I completely misunderstanding this?

jrbourbeau commented 3 years ago

Thanks for outlining a nice reproducer @jbusecke, I'll see if I can recreate the issue on pangeo cloud (which I have access to now 🎉)

I would like to learn more how I can inspect the task graph

Just in case you haven't seen these pages yet, I recommend checking out:

to get a good sense for what APIs are available for inspecting task graphs (either low-level dict task graphs, or high-level Dask collections like Dask Arrays).

For the specific example you proposed I would recommend something like the following:

# Extract underlying Dask array which backs our Xarray Dataset
x = ds.simple.isel(time=0, x=0, y=0).data

# Get the keys which correspond to the final output partitions of our Dask array
keys = x.__dask_keys__()

# Cull all tasks which aren't needed to compute our output partitions
# Note that `HighLevelGraph`s have their own `cull` method
x_opt = x.dask.cull(set(keys))

# Visualize the optimized graph (it should be much smaller than the original `x` graph)
dask.visualize(x_opt)
Complete example: ```python # Lets first create a simple dummy dataset import dask import dask.array as dsa import xarray as xr nt = 3600 so = xr.DataArray(dsa.random.random(size=(1440, 1080, 35, nt), chunks=(1440, 270, 35, 1)), dims=['x', 'y', 'z', 'time']) thetao = xr.DataArray(dsa.random.random(size=(1440, 1080, 35, nt), chunks=(1440, 270, 35, 1)), dims=['x', 'y', 'z', 'time']) a = xr.DataArray(dsa.random.random(size=(1440, 1080, 35, nt), chunks=(1440, 270, 35, 1)), dims=['x', 'y', 'z', 'time']) b = xr.DataArray(dsa.random.random(size=(1440, 1080, 35, nt), chunks=(1440, 270, 35, 1)), dims=['x', 'y', 'z', 'time']) ds = xr.Dataset({'so':so, 'thetao':thetao, 'a':a, 'b':b}) # layer a simple xarray.apply_ufunc def simple_func(salt, temp): return salt+temp ds['simple'] = xr.apply_ufunc(simple_func, ds.so, ds.thetao, dask="parallelized") # This also blows out the memory # Extract underlying Dask array which backs the Xarray Dataset x = ds.simple.isel(time=0, x=0, y=0).data # Get the keys which correspond to the final output partitions of our Dask array keys = x.__dask_keys__() # Cull all tasks which aren't needed to compute our output partitions x_opt = x.dask.cull(set(keys)) # Visualize the optimized graph (it should be much smaller than the original `x` graph) dask.visualize(x_opt) ```

P.S.: I know there was a discussion about adding the concept of 'memory pressure' started by @rabernat I believe, but I cannot find it at the moment.

I think https://github.com/dask/distributed/issues/2602 is the issue you're referencing. I'll try to refamiliarize myself with the discussion there

mrocklin commented 3 years ago

@jrbourbeau has there been any progress here? In principle this seems like it should be a slam dunk application. I'm curious what's going on.

Also, putting on my Coiled hat, I encourage you to push on using Coiled for this alongside the Pangeo work. If there are issues (I suspect that moving large graphs across the open internet to be one for example) then we should highlight them.

jrbourbeau commented 3 years ago

Last Friday @gjoseph92 and I went through the example workflow @jbusecke posted

We found that things scaled as expected when we simply increased the size of the time axis for the dataset. That is, if we doubled the length of the time axis the workload ran with roughly the same performance characteristics, but it took twice as long because there were twice as many tasks. Here's a performance report for the larger version of the workflow @jbusecke mentioned above (i.e. nt = 1200). You'll notice that the task stream looks both saturated (no white space) and uniform throughout the computation. This is what I would have expected for an embarrassingly parallel workload.

However, we then noticed that in the two examples above the chunk size was also changed (from (1440, 270, 35, 1) to (360, 360, 35, 1)) in addition to increasing the size of the time axis. When we did that we observed a large number of data generating tasks (in this case from generating the random dataset) were quickly run on the workers (here's the corresponding performance report). This resulted in the worker's memory filling up, spilling in-memory results to disk (lots of yellow in the task stream), and an overall degradation in performance. Eventually the cluster re-calibrated and the memory-consuming tasks began to spread out which relieved memory pressure on the workers / the need to spill to disk. This is the last ~40% of the task stream.

What makes this even more interesting is that I was not able to reproduce this behavior. I tried several different configurations and orderings (e.g. computation with small chunks followed by one with large chunks and vice versa) but I was never able to reproduce the memory pressure issue again. @jbusecke are you able to consistently produce these poor performance issues with this example? I can also try some of the snippets @rabernat posted in https://github.com/dask/distributed/issues/2602

mrocklin commented 3 years ago

Ryan's issue is different in that it is not embarassingly parallel. Memory pressure is a bigger deal when you have some other system, like inter-worker communication, that can cause memory-freeing tasks to run at the same pace as memory-producing tasks.

mrocklin commented 3 years ago

Similarly, looking at the second performance report, I see a lot more communication. I wonder if this is being caused by errant load balancing / work stealing decisions.

jrbourbeau commented 3 years ago

I'm also curious if errant work stealing is playing a role as modifying the chunk size will impact TaskPrefix.duration_average for these tasks -- which is used to make work stealing decisions. Though since I've not been able to reproduce the issue I haven't been able to investigate further

jrbourbeau commented 3 years ago

To put this in perspective, dealing with issues like this, and coming up with everchanging 'ugly' solutions like looping over smaller time slices, etc, has taken up a considerable amount of my work hours in the past months/years. A solution to this would be an absolute godsend to my scientific productivity.

@jbusecke given that I wasn't able to reproduce the issue consistently with the above snippet, would you be up for hopping on a call with @gjoseph92 and I to go through one of your problematic workloads? The goal here would be for us to try and come away with a notebook that @gjoseph92 and I could then dig deeper into to see what's causing the underlying issue and try to improve the situation upstream in Dask

jbusecke commented 3 years ago

Sorry for the late response here. I got a bit overwhelmed by my workload and dropped this.

I would be very curious to talk more about this, but I think it might be better to work on actual workflow?

I am prototyping a (what I would call typical) cmip6 climate model processing computation in the next days, and had quite a few hickups the last time I ran it. I could isolate a problematic model and parse that out as an example notebook and we could chat some time next week?

jrbourbeau commented 3 years ago

That sounds great @jbusecke

mrocklin commented 3 years ago

I was just speaking with @gjoseph92 . Seeing memory use get worse as we make chunking more fine grained points a possible finger at unmanaged memory (smaller chunks of memory get allocated differently by the operating system than larger chunks). A good way to test this hypothesis would be to run this computation again with a version of Dask released after April, when we changed the memory chart to include a breakdown of managend and unmanaged memory.

If that is indeed the problem then this might be resolved either by using larger chunks (sorry) setting environment variables, or by trimming memory periodically (I think that James may recently have pointed this group to that trick?)

jrbourbeau commented 3 years ago

A good way to test this hypothesis would be to run this computation again with a version of Dask released after April, when we changed the memory chart to include a breakdown of managend and unmanaged memory.

See these docs https://distributed.dask.org/en/latest/worker.html#using-the-dashboard-to-monitor-memory-usage for information on the different types of memory Dask workers now keep track of (in particular, "unmanaged" memory)

If that is indeed the problem then this might be resolved either by using larger chunks (sorry) setting environment variables, or by trimming memory periodically (I think that James may recently have pointed this group to that trick?)

See these docs https://distributed.dask.org/en/latest/worker.html#memory-not-released-back-to-the-os for the memory trimming trick

mrocklin commented 3 years ago

With both unmanaged memory being tracked, and now neighbor/sibling/ordering scheduling (need to decide on a name for this) I think that there is a good chance that we're in good shape here. I'm keen to try this again. @gjoseph92, maybe this makes sense to add to your queue?

jbusecke commented 3 years ago

Amazing. Thanks for working on this, everyone. Starting next week I can also allocate some time to test things out in more 'real-life' scenarios. Let me know if that would be of help.

mrocklin commented 3 years ago

To put this in perspective, dealing with issues like this, and coming up with everchanging 'ugly' solutions like looping over smaller time slices, etc, has taken up a considerable amount of my work hours in the past months/years. A solution to this would be an absolute godsend to my scientific productivity.

@jbusecke I feel like we may now be in a good spot. I'm hopeful that https://github.com/dask/distributed/pull/4967 has this problem covered . I give it a 60% chance of solving your problem. Do you have workloads around that you'd be interested in trying against it?

mrocklin commented 3 years ago

It has, so far, met expectations on artifical examples that we've given it. Other groups that we've engaged have said that they've gotten speedups from it, even on workloads that it was not designed to address. If you have some time I'd love to see if this helps to solve some of your deeper issues here.

mrocklin commented 3 years ago

My sense is that this will be easier for people to check out after we have things in a release somewhere. Alternatively, would it be easier for you all to use this is we created a docker image for you? How hard is it for you to try out different versions of things at scale?