Closed czackl closed 2 years ago
Concerning the first and the second plot: The whole "sorting by mean expression" idea might be irrelevant as low expressed genes could be as important to a signature as high expressed ones. The assumption basicly is "the higher the more important" but that could be wrong ➝ on TODO List
Hey @constantin-zackl thanks for sharing this.
Here are a few comments/questions from my side:
One Signature - Mean Expression
Why would you want to average the expression across cell types? I would say it is more informative to find genes that have high expression in one cell type but not the others.
One Signature - Relevant Gene Heatmap
I like this approach better. You could log-scale the TPM/CPM after adding 1 (to avoid log(0)). And further take the z score to make gene expression ranges comparables in the visualization:
( x - mean(x) ) / sd(x)
Where the mean and sd are computed for each gene, considering all values it takes across samples.
We have a dynamic way of sorting the heatmap, e.g. grouping cells and genes.
We could use the union of all signature genes (all methods) and possibly encode NA's using a different color.
Two Signatures - Difference Heatmap, Clustered
Maybe I would try to order columns so to visualize better the commonalities (i.e. cluster white cells)
A few more ideas before going into more complex signature comparison approaches:
kappa(signature, exact = TRUE)
I hope this helps, Francesca
Quick idea: we could have a section/tab also to explore the input scRNA-seq data. For instance, one useful visualization would be a violin plot showing cell-specific mRNA content bias as done by @alex-d13. Alex, can you share an example plot of the number of expressed genes?
Hi @FFinotello, the input scRNA Tab idea sounds great! I am currently working on the signatures:
Where the mean and sd are computed for each gene, considering all values it takes across samples.
I am a little bit unsure about the "all values it takes across samples" part for the z-score as the signature is a gene x celltype matrix. Would that be the values from the bulk data as it ist the only gene x sample matrix?
Plots are following
For instance, one useful visualization would be a violin plot showing cell-specific mRNA content bias as done by @alex-d13. Alex, can you share an example plot of the number of expressed genes?
This would be such a plot for the Travaglini dataset I used:
Hi @FFinotello, the input scRNA Tab idea sounds great! I am currently working on the signatures:
Where the mean and sd are computed for each gene, considering all values it takes across samples.
I am a little bit unsure about the "all values it takes across samples" part for the z-score as the signature is a gene x celltype matrix. Would that be the values from the bulk data as it ist the only gene x sample matrix?
Plots are following
Sorry, I was speaking about samples in general terms, as opposed to genes. But I meant cell types in this case. So, x should be the vector of expression of a certain gene across cell types.
Ah okay now that makes sense, thanks :smiley:
I added Numbers to the plots for easier communication. The easiest ones first, both take named lists of signatures as input. | ||
---|---|---|
Now the Signature Heatmap:
The problem with the signature right now is its size, i went with plotly first to give users the option to zoom in have a closer look to actually see the gene idendifiers but the performance is really affecting the usability. At the moment i am looking for a way to render the heatmap "very wide" and give the user a horizontal scrollbar. I have seen a "lasso select" with plots before, this could be a nice feature for extracting the gene identifiers of specific regions of the plot. (I will upload clustered versions shortly).
I also tried ordering by mean once like done in Plot 2, so Genes expressed high in one cell type and (very) low in the others gather on the right side, but these include rows with mostly zeros too.
Will add further plots successively
Here a clustered heatmap. I am working on a solution to extract the gene names from specific regions if this is helpful.
Now the Upset Plot, it can be calculated in three different modes (distinct, intersect, union), info here "Intersect" -> In Set if Gene present in both Signatures Intersection size and Genes in the sets can be extracted for downloading / table view
Note: Single Signature plots where rendered using a bisque siganture
6 and 7 don't seem to be really useful in retrospect.
Here another Heatmap, same as 8 but partitioned and split using k-means (with number of clusters = number of cell types). Unfortunately i was not able to control the order of the chunks yet so they will have a different order every time they are recalculated, working on that.
I had another idea for the signatures but i am little unsure about the results.
I wanted to see if the genes/clusters from the heatmap above actually separate well. I would expect to have "better" deconvolution results if they do, but i could be wrong here. This is a tSNE with the same data as in the heatmap, so log10 and z-scored. Colors are kmeans partitions, so the "columns" of the heatmap above.
bisque | momf | cibersortx |
---|---|---|
Federico suggested to have a look at the silhouette score, will have a look at that later.
Does something like this make sense?
Update: I found a feature to extract clusters from the heatmap directly (Problem: kmeans starts with random centers) so in the following plots the clusters between the plots show the same genes (see the numbers for annotation). I also added a silhouette score plot.
These plots are for a bisque signature.
Heatmap | tsne | silhouette score |
---|---|---|
Tbh, i have seen much better clustering. The clusters don't really separate at all, but this doesn't have to be due to tSNE, i will test a different dataset when i have one. However, some features can be seen very good like the large overlaps of clusters 1 & 2 or the difficult separation of cluster 3 as seen in the heatmap. Also the silhouette score plot confirms the poor quality of the clustering.
One could in fact think about refining a signature by removing "noisy" genes (potentially parts of cluster 3)
Do you think the general approach could be useful?
We could use the score i am using for creating signatures to annotate the signature heatmap a little bit better. A higher entropy value indicates a "less informative" or "less significant" gene.
Both signatures cluster rows and columns. Annotation is possible by lines or barplots.
A signature made with the tools in the signatureGeneration repo:
Til10:
Regarding the heatmap: I tried making a bicluster heatmap but this seems to be more difficult than expected. If there are packages you can recommend :) (i tried biclust but did not archive the results i expected)
Edit: For now i removed the "heatmap segmenting by kmeans", i think there is not really an information gain and computation is much faster without.
The signature comparison / exploration is problably located best in a new DeconvExplorer Tab. All Plots are rendered in Plotly ➝ users can zoom in, etc.
Plotting Ideas
Feel free to comment every idea and suggestion you have
1 One Signature - Mean Expression
Calculated the mean expression for each gene over all celltypes, log10 scaled, with user chosen threshold to export a "relevant_gene_list". The Idea is to select the most relevant genes for each signature.
2 One Signature - Relevant Gene Heatmap
Basicly the same chart but the expression for each celltype is displayed, log10 scaled, genes are in the same order as in plot above. Easy to spot outliers.
3 Two Signatures - Difference Heatmap, Clustered
Intersected two signatures and calculated the difference. Positive Value :red_square: : The first signature (bisque) has higher expression values Negative Value :blue_square: : The second signature (cibersortx) has higher expression values Neutral / Zero :white_circle: : Both signatures are (almost) the same
Log scaling of negative values is handled the following way:
savetheplanet Vibe :earth_africa:
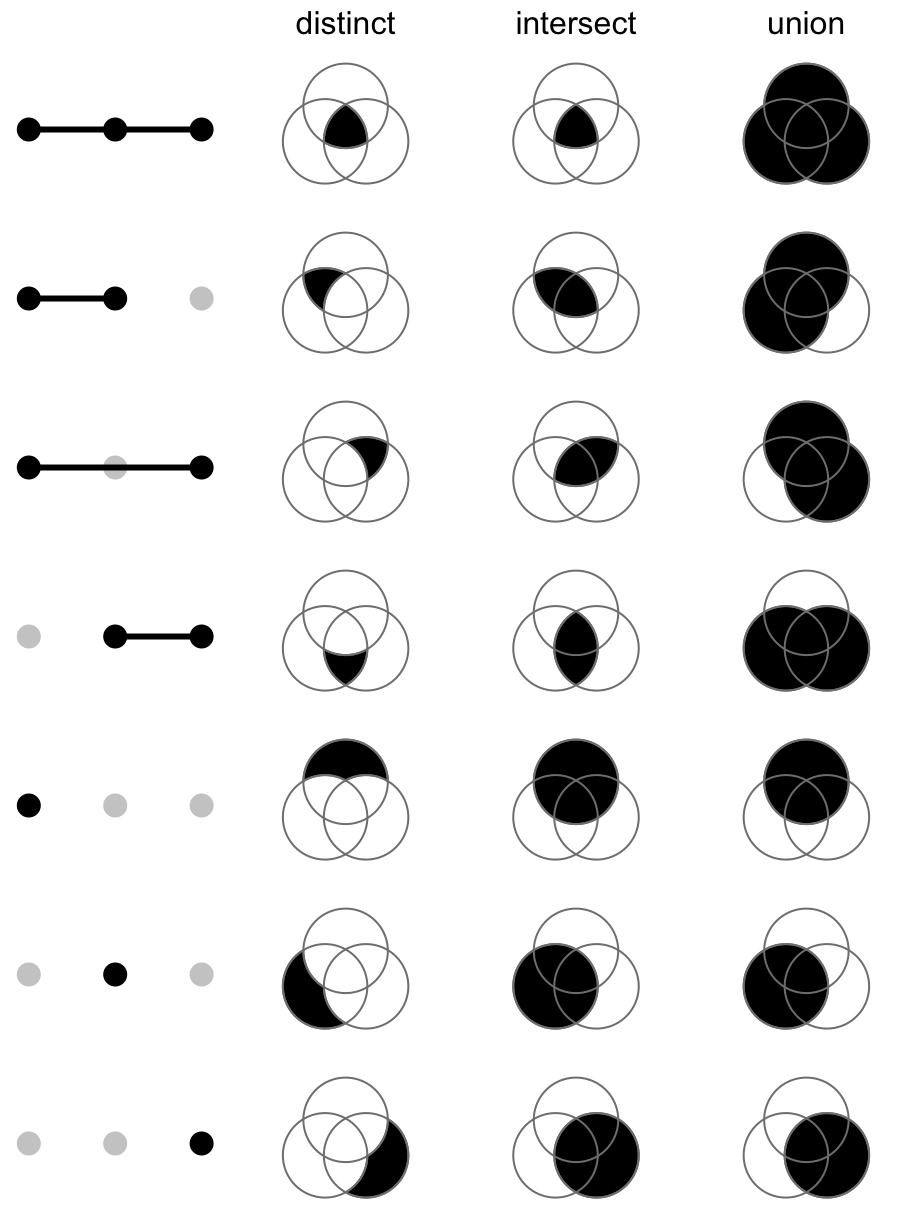
More than two signatures
Upset Plot
ToDo
to be continued