open-telemetry / opentelemetry-java-instrumentation

OpenTelemetry auto-instrumentation and instrumentation libraries for Java
https://opentelemetry.io
Apache License 2.0
1.91k stars 835 forks source link

About the problem of sending logs to tempo to report errors #8949

Closed FrankCy closed 1 year ago

FrankCy commented 1 year ago

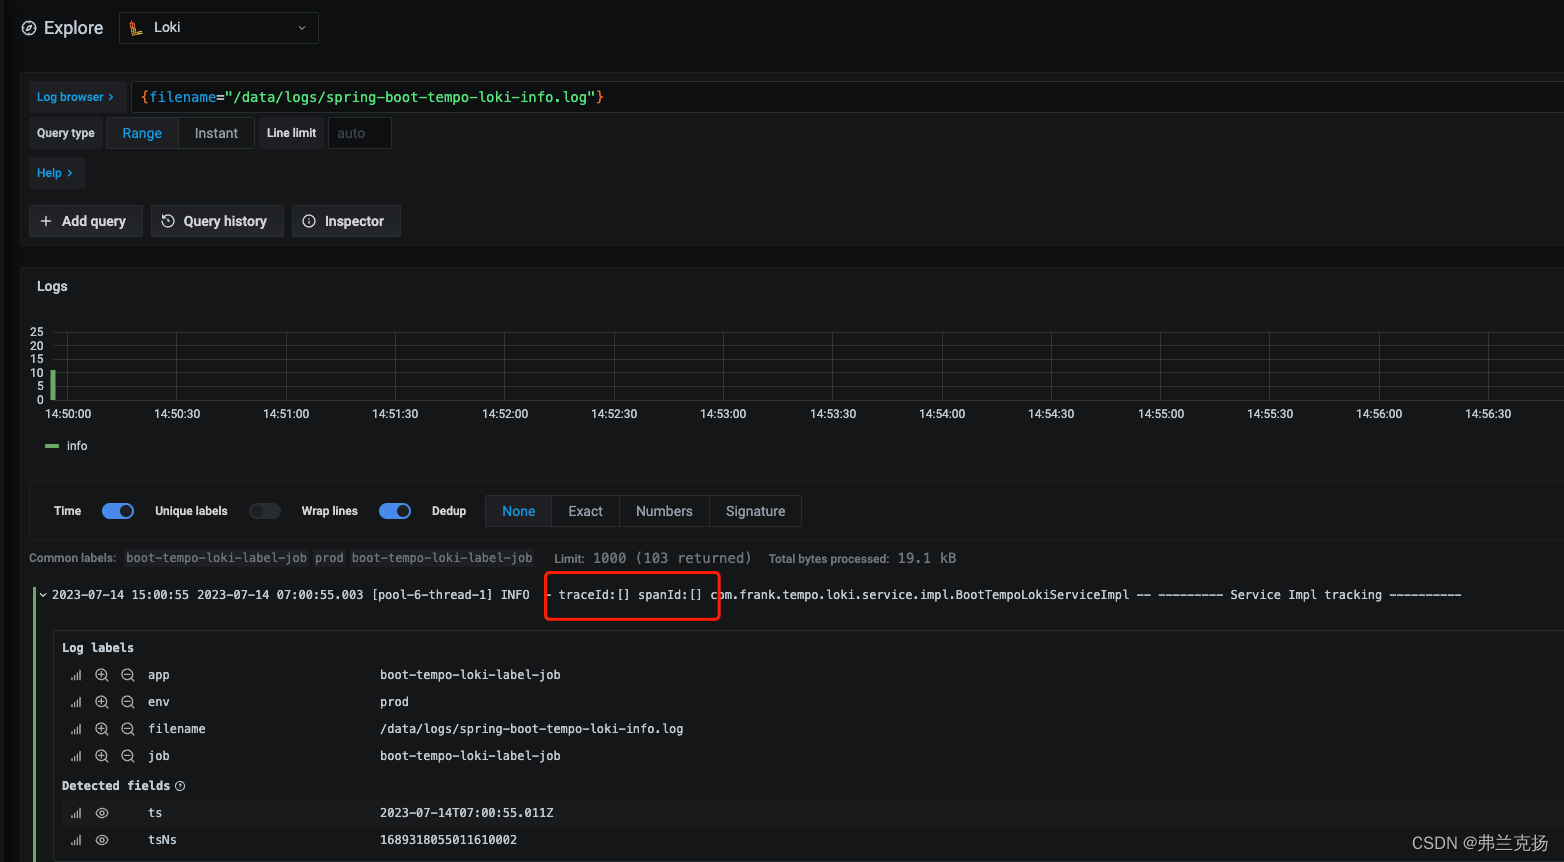
The following error is reported when the program starts:

[otel.javaagent 2023-07-14 06:05:52:512 +0000] [main] INFO io.opentelemetry.javaagent.tooling.VersionLogger - opentelemetry-javaagent - version: 1.27.0
[otel.javaagent 2023-07-14 06:05:52:513 +0000] [main] DEBUG io.opentelemetry.javaagent.tooling.VersionLogger - Running on Java 1.8.0_221. JVM Java HotSpot(TM) 64-Bit Server VM - Oracle Corporation - 25.221-b11
[otel.javaagent 2023-07-14 06:05:52:513 +0000] [main] DEBUG io.opentelemetry.javaagent.tooling.AgentInstaller - io.opentelemetry.javaagent.tooling.AgentInstaller loaded on io.opentelemetry.javaagent.bootstrap.AgentClassLoader@7d4991ad
[otel.javaagent 2023-07-14 06:05:52:515 +0000] [main] DEBUG io.opentelemetry.javaagent.tooling.SafeServiceLoader - Unable to load instrumentation class: io/opentelemetry/javaagent/shaded/instrumentation/javaagent/runtimemetrics/java17/Java17RuntimeMetricsInstaller has been compiled by a more recent version of the Java Runtime (class file version 61.0), this version of the Java Runtime only recognizes class file versions up to 52.0
[otel.javaagent 2023-07-14 06:05:52:580 +0000] [main] INFO io.opentelemetry.sdk.autoconfigure.AutoConfiguredOpenTelemetrySdkBuilder - Error encountered during autoconfiguration. Closing partially configured components.
OpenTelemetry Javaagent failed to start
io.opentelemetry.sdk.autoconfigure.spi.ConfigurationException: OTLP endpoint must be a valid URL: 192.168.163.172:4317
        at io.opentelemetry.exporter.internal.otlp.OtlpConfigUtil.validateEndpoint(OtlpConfigUtil.java:211)
        at io.opentelemetry.exporter.internal.otlp.OtlpConfigUtil.configureOtlpExporterBuilder(OtlpConfigUtil.java:74)
        at io.opentelemetry.exporter.otlp.internal.OtlpMetricExporterProvider.createExporter(OtlpMetricExporterProvider.java:57)
        at io.opentelemetry.sdk.autoconfigure.SpiUtil.lambda$loadConfigurable$0(SpiUtil.java:48)
        at io.opentelemetry.sdk.autoconfigure.NamedSpiManager.tryLoadImplementationForName(NamedSpiManager.java:46)
        at java.util.concurrent.ConcurrentHashMap.computeIfAbsent(ConcurrentHashMap.java:1660)
        at io.opentelemetry.sdk.autoconfigure.NamedSpiManager.getByName(NamedSpiManager.java:36)
        at io.opentelemetry.sdk.autoconfigure.MetricExporterConfiguration.configureExporter(MetricExporterConfiguration.java:88)
        at io.opentelemetry.sdk.autoconfigure.MetricExporterConfiguration.configureReader(MetricExporterConfiguration.java:58)
        at io.opentelemetry.sdk.autoconfigure.MeterProviderConfiguration.lambda$configureMetricReaders$0(MeterProviderConfiguration.java:76)
        at java.util.stream.ReferencePipeline$3$1.accept(ReferencePipeline.java:193)
        at java.util.Collections$2.tryAdvance(Collections.java:4719)
        at java.util.Collections$2.forEachRemaining(Collections.java:4727)
        at java.util.stream.AbstractPipeline.copyInto(AbstractPipeline.java:482)
        at java.util.stream.AbstractPipeline.wrapAndCopyInto(AbstractPipeline.java:472)
        at java.util.stream.ReduceOps$ReduceOp.evaluateSequential(ReduceOps.java:708)
        at java.util.stream.AbstractPipeline.evaluate(AbstractPipeline.java:234)
        at java.util.stream.ReferencePipeline.collect(ReferencePipeline.java:499)
        at io.opentelemetry.sdk.autoconfigure.MeterProviderConfiguration.configureMetricReaders(MeterProviderConfiguration.java:79)
        at io.opentelemetry.sdk.autoconfigure.MeterProviderConfiguration.configureMeterProvider(MeterProviderConfiguration.java:51)
        at io.opentelemetry.sdk.autoconfigure.AutoConfiguredOpenTelemetrySdkBuilder.build(AutoConfiguredOpenTelemetrySdkBuilder.java:347)
        at io.opentelemetry.javaagent.tooling.OpenTelemetryInstaller.installOpenTelemetrySdk(OpenTelemetryInstaller.java:34)
        at io.opentelemetry.javaagent.tooling.AgentInstaller.installBytebuddyAgent(AgentInstaller.java:120)
        at io.opentelemetry.javaagent.tooling.AgentInstaller.installBytebuddyAgent(AgentInstaller.java:100)
        at io.opentelemetry.javaagent.tooling.AgentStarterImpl.start(AgentStarterImpl.java:98)
        at io.opentelemetry.javaagent.bootstrap.AgentInitializer$1.run(AgentInitializer.java:53)
        at io.opentelemetry.javaagent.bootstrap.AgentInitializer$1.run(AgentInitializer.java:47)
        at io.opentelemetry.javaagent.bootstrap.AgentInitializer.execute(AgentInitializer.java:64)
        at io.opentelemetry.javaagent.bootstrap.AgentInitializer.initialize(AgentInitializer.java:46)
        at io.opentelemetry.javaagent.OpenTelemetryAgent.startAgent(OpenTelemetryAgent.java:57)
        at io.opentelemetry.javaagent.OpenTelemetryAgent.premain(OpenTelemetryAgent.java:45)
        at sun.reflect.NativeMethodAccessorImpl.invoke0(Native Method)
        at sun.reflect.NativeMethodAccessorImpl.invoke(NativeMethodAccessorImpl.java:62)
        at sun.reflect.DelegatingMethodAccessorImpl.invoke(DelegatingMethodAccessorImpl.java:43)
        at java.lang.reflect.Method.invoke(Method.java:498)
        at sun.instrument.InstrumentationImpl.loadClassAndStartAgent(InstrumentationImpl.java:386)
        at sun.instrument.InstrumentationImpl.loadClassAndCallPremain(InstrumentationImpl.java:401)
Caused by: java.net.MalformedURLException: no protocol: 192.168.163.172:4317
        at java.net.URL.<init>(URL.java:600)
        at java.net.URL.<init>(URL.java:497)
        at java.net.URL.<init>(URL.java:446)
        at io.opentelemetry.exporter.internal.otlp.OtlpConfigUtil.validateEndpoint(OtlpConfigUtil.java:209)
        ... 36 more
FrankCy commented 1 year ago

The startup command is as follows:

java -javaagent:/data/server/boot_pro/opentelemetry-javaagent-1.27.0.jar -Dotel.resource.attributes=service.name=spring-boot-tempo-loki -Dotel.traces.exporter=otlp -Dotel.javaagent.debug=true  -Dotel.exporter.otlp.endpoint=192.168.163.172:4317 -jar spring-boot-tempo-loki-1.0-SNAPSHOT.jar
FrankCy commented 1 year ago

The goal is to realize the link monitoring of the spring boot program collected by tempo. What adjustments need to be made? Spring Boot: 2.1.3.RELEASE Java: java version 1.8.0_221 Temp: 2.1.1

FrankCy commented 1 year ago

After modifying to http://192.168.163.172:4317, there is no mistake, but traceI is not automatically generated, how to adjust?

FrankCy commented 1 year ago

After modifying to http://192.168.163.172:4317, there is no mistake, but traceI is not automatically generated, how to adjust?

https://img-blog.csdnimg.cn/d5ffc79233174b8bb138e9ae30f65910.png

laurit commented 1 year ago

Trace id is only present when there is an active trace. Trace is usually started when there is an incoming http request, rpc call, message etc. Having no trace is the expected behavior for code that runs in a background thread.

FrankCy commented 1 year ago

THK,Yes, my verification program has Http requests to the Controller, but the traceId is not printed out. My log4j-spring.xml is as follows:

<?xml version="1.0" encoding="UTF-8"?>
<Configuration status="WARN" monitorInterval="30">
<Properties>
<Property name="LOG_PATTERN">%d{yyyy-MM-dd HH:mm:ss.SSS} [%t] %-5level - traceId:[%X{traceId}] spanId:[%X{spanId}] %c{36} -- %m%n</Property>
<Property name="LOG_PATTERN_ERROR">%d{yyyy-MM-dd HH:mm:ss.SSS} [%t] %-5level - traceId:[%X{traceId}] spanId:[%X{spanId}] %c{36} %l %M -- %m%n</Property>
<Property name="APP_LOG_ROOT">/data/logs</Property>
<Property name="APP_LOG_NAME">spring-boot-tempo-loki</Property>
</Properties>
<Appenders>
<Console name="Console" target="SYSTEM_OUT" follow="true">
<PatternLayout charset="UTF-8" pattern="${LOG_PATTERN}"/>
</Console>
<RollingFile name="RollingFileInfo"
fileName="${APP_LOG_ROOT}/${APP_LOG_NAME}-info.log"
filePattern="${APP_LOG_ROOT}/${date:yyyy-MM}/${APP_LOG_NAME}-info-%d{yyyy-MM-dd}-%i.log">
<ThresholdFilter level="info" onMatch="ACCEPT" onMismatch="DENY"/>
<PatternLayout charset="UTF-8" pattern="${LOG_PATTERN}"/>
<Policies>
<TimeBasedTriggeringPolicy interval="1" modulate="true"/>
<SizeBasedTriggeringPolicy size="100MB"/>
</Policies>
<DefaultRolloverStrategy max="10"/>
</RollingFile>
<RollingRandomAccessFile name="RollingFileError"
fileName="${APP_LOG_ROOT}/${APP_LOG_NAME}-error.log"
filePattern="${APP_LOG_ROOT}/${date:yyyy-MM}/${APP_LOG_NAME}-error-%d{yyyy-MM-dd}-%i.log">
<ThresholdFilter level="error" onMatch="ACCEPT" onMismatch="DENY"/>
<PatternLayout charset="UTF-8" pattern="${LOG_PATTERN_ERROR}"/>
<Policies>
<TimeBasedTriggeringPolicy/>
<SizeBasedTriggeringPolicy size="100MB"/>
</Policies>
<DefaultRolloverStrategy max="10"/>
</RollingRandomAccessFile>
</Appenders>
<Loggers>
<Root level="info">
<AppenderRef ref="Console"/>
<AppenderRef ref="RollingFileInfo"/>
</Root>
<Logger name="org.springframework" additivity="false">
<AppenderRef ref="RollingFileInfo"/>
<AppenderRef ref="Console"/>
</Logger>
<Logger name="org.mybatis" additivity="false">
<AppenderRef ref="RollingFileInfo"/>
<AppenderRef ref="Console"/>
</Logger>
<Logger name="com.frank" additivity="false">
<AppenderRef ref="RollingFileInfo"/>
<AppenderRef ref="Console"/>
</Logger>
<Logger name="com.ibatis.sqlmap.engine.impl.SqlMapClientDelegate" level="debug" additivity="false">
<AppenderRef ref="Console"/>
</Logger>
<Logger name="org.mybatis" level="debug" additivity="false">
<AppenderRef ref="Console"/>
</Logger>
<Logger name="java.sql" level="debug" additivity="false">
<AppenderRef ref="Console"/>
</Logger>
<Logger name="java.sql.Connection" level="debug" additivity="false">
<AppenderRef ref="Console"/>
</Logger>
<Logger name="java.sql.Statement" level="debug" additivity="false">
<AppenderRef ref="Console"/>
</Logger>
<Logger name="java.sql.PreparedStatement" level="debug" additivity="false">
<AppenderRef ref="Console"/>
</Logger>
</Loggers>
</Configuration>

Does this configuration need to be adjusted?

laurit commented 1 year ago

Please provide a minimal application that reproduces your issue along with instructions on how to reproduce.

FrankCy commented 1 year ago

Please provide a minimal application that reproduces your issue along with instructions on how to reproduce.

pom:

   <properties>
        <maven.compiler.source>8</maven.compiler.source>
        <maven.compiler.target>8</maven.compiler.target>
        <opentelemetry.version>1.7.1</opentelemetry.version>
    </properties>

    <dependencies>
        <dependency>
            <groupId>io.opentelemetry</groupId>
            <artifactId>opentelemetry-exporter-otlp</artifactId>
            <version>${opentelemetry.version}</version>
        </dependency>

        <dependency>
            <groupId>org.springframework.boot</groupId>
            <artifactId>spring-boot-starter-web</artifactId>
            <exclusions>
                <exclusion>
                    <groupId>org.apache.logging.log4j</groupId>
                    <artifactId>log4j-api</artifactId>
                </exclusion>
                <exclusion>
                    <groupId>org.apache.logging.log4j</groupId>
                    <artifactId>log4j-core</artifactId>
                </exclusion>
                <exclusion>
                    <groupId>org.springframework.boot</groupId>
                    <artifactId>spring-boot-starter-logging</artifactId>
                </exclusion>
            </exclusions>
        </dependency>

        <dependency>
            <groupId>org.springframework.boot</groupId>
            <artifactId>spring-boot-starter-data-redis</artifactId>
        </dependency>

        <dependency>
            <groupId>org.projectlombok</groupId>
            <artifactId>lombok</artifactId>
        </dependency>

        <dependency>
            <groupId>org.apache.commons</groupId>
            <artifactId>commons-lang3</artifactId>
        </dependency>

        <dependency>
            <groupId>com.alibaba</groupId>
            <artifactId>fastjson</artifactId>
        </dependency>

        <dependency>
            <groupId>org.springframework.boot</groupId>
            <artifactId>spring-boot-starter-test</artifactId>
        </dependency>
        <dependency>
            <groupId>cn.hutool</groupId>
            <artifactId>hutool-all</artifactId>
        </dependency>

        <dependency>
            <groupId>org.springframework.boot</groupId>
            <artifactId>spring-boot-starter-log4j2</artifactId>
        </dependency>

        <!-- https://mvnrepository.com/artifact/com.squareup.okhttp/okhttp -->
        <dependency>
            <groupId>com.squareup.okhttp</groupId>
            <artifactId>okhttp</artifactId>
            <version>2.7.5</version>
        </dependency>

        <!-- https://mvnrepository.com/artifact/com.squareup.okio/okio -->
        <dependency>
            <groupId>com.squareup.okio</groupId>
            <artifactId>okio</artifactId>
            <version>1.6.0</version>
        </dependency>

    </dependencies>

Controller:

@Slf4j
@Controller
@RequestMapping("/bootTempoLoki")
public class BootTempoLokiController {

    @Autowired
    private BootTempoLokiService bootTempoLokiService;

    @GetMapping(value = "/tracking")
    @ResponseBody
    public Result tracking() {
        log.info("--------- Controller tracking ----------");
        return bootTempoLokiService.tracking();
    }

}

The startup command is as follows:

java -javaagent:/data/server/boot_pro/opentelemetry-javaagent-1.27.0.jar -Dotel.resource.attributes=service.name=spring-boot-tempo-loki -Dotel.traces.exporter=otlp -Dotel.javaagent.debug=true  -Dotel.exporter.otlp.endpoint=192.168.163.172:4317 -jar spring-boot-tempo-loki-1.0-SNAPSHOT.jar
mateuszrzeszutek commented 1 year ago

https://img-blog.csdnimg.cn/d5ffc79233174b8bb138e9ae30f65910.png

This link is not accessible, I get a 403 when I open it.

The startup command is as follows:

java -javaagent:/data/server/boot_pro/opentelemetry-javaagent-1.27.0.jar -Dotel.resource.attributes=service.name=spring-boot-tempo-loki -Dotel.traces.exporter=otlp -Dotel.javaagent.debug=true  -Dotel.exporter.otlp.endpoint=192.168.163.172:4317 -jar spring-boot-tempo-loki-1.0-SNAPSHOT.jar

The endpoint needs to be http://192.168.163.172:4317, as mentioned previously.

but traceI is not automatically generated, how to adjust?

Some of the logs will not have the traceId assigned to them; only the log statements that are logged when there is an active trace will have that.

Can you post exactly what you're expecting, and what is the actual result you're getting?

FrankCy commented 1 year ago

THK,I expect to do full link tracking of my spring boot program through tempo. There is no problem with the startup, but no data is reported to tempo.

Now there is no error in the startup program, but the traceId is not printed, and there is no information in the tempo view of grafana. But using opentelemetry-javaagent-0.9.0.jar can print traceId, but the report will be wrong.

java -javaagent:/data/server/boot_pro/opentelemetry-javaagent-all-0.9.0.jar -Dotel.resource.attributes=service.name=spring-boot-tempo-loki -Dotel.traces.exporter=otlp  -Dotel.exporter.otlp.endpoint=192.168.163.172:4317 -jar spring-boot-tempo-loki-1.0-SNAPSHOT.jar
[opentelemetry.auto.trace 2023-07-14 09:17:04:827 +0000] [grpc-default-executor-0] WARN io.opentelemetry.exporters.otlp.OtlpGrpcMetricExporter - Failed to export metrics
io.grpc.StatusRuntimeException: UNIMPLEMENTED: unknown service opentelemetry.proto.collector.metrics.v1.MetricsService
        at io.grpc.Status.asRuntimeException(Status.java:533)
        at io.grpc.stub.ClientCalls$UnaryStreamToFuture.onClose(ClientCalls.java:515)
        at io.grpc.PartialForwardingClientCallListener.onClose(PartialForwardingClientCallListener.java:39)
        at io.grpc.ForwardingClientCallListener.onClose(ForwardingClientCallListener.java:23)
        at io.grpc.ForwardingClientCallListener$SimpleForwardingClientCallListener.onClose(ForwardingClientCallListener.java:40)
        at io.grpc.internal.CensusStatsModule$StatsClientInterceptor$1$1.onClose(CensusStatsModule.java:700)
        at io.grpc.PartialForwardingClientCallListener.onClose(PartialForwardingClientCallListener.java:39)
        at io.grpc.ForwardingClientCallListener.onClose(ForwardingClientCallListener.java:23)
        at io.grpc.ForwardingClientCallListener$SimpleForwardingClientCallListener.onClose(ForwardingClientCallListener.java:40)
        at io.grpc.internal.CensusTracingModule$TracingClientInterceptor$1$1.onClose(CensusTracingModule.java:399)
        at io.grpc.internal.ClientCallImpl.closeObserver(ClientCallImpl.java:510)
        at io.grpc.internal.ClientCallImpl.access$300(ClientCallImpl.java:66)
        at io.grpc.internal.ClientCallImpl$ClientStreamListenerImpl.close(ClientCallImpl.java:630)
        at io.grpc.internal.ClientCallImpl$ClientStreamListenerImpl.access$700(ClientCallImpl.java:518)
        at io.grpc.internal.ClientCallImpl$ClientStreamListenerImpl$1StreamClosed.runInternal(ClientCallImpl.java:692)
        at io.grpc.internal.ClientCallImpl$ClientStreamListenerImpl$1StreamClosed.runInContext(ClientCallImpl.java:681)
        at io.grpc.internal.ContextRunnable.run(ContextRunnable.java:37)
        at io.grpc.internal.SerializingExecutor.run(SerializingExecutor.java:123)
        at java.util.concurrent.ThreadPoolExecutor.runWorker(ThreadPoolExecutor.java:1149)
        at java.util.concurrent.ThreadPoolExecutor$Worker.run(ThreadPoolExecutor.java:624)
        at java.lang.Thread.run(Thread.java:748)
FrankCy commented 1 year ago

Debug mode found a bug:

[otel.javaagent 2023-07-14 09:23:24:691 +0000] [OkHttp http://192.168.163.172:4317/...] ERROR io.opentelemetry.exporter.internal.grpc.OkHttpGrpcExporter - Failed to export metrics. Server responded with UNIMPLEMENTED. This usually means that your collector is not configured with an otlp receiver in the "pipelines" section of the configuration. If export is not desired and you are using OpenTelemetry autoconfiguration or the javaagent, disable export by setting OTEL_METRICS_EXPORTER=none. Full error message: unknown service opentelemetry.proto.collector.metrics.v1.MetricsService
        [otel.javaagent 2023-07-14 09:23:24:692 +0000] [OkHttp http://192.168.163.172:4317/...] DEBUG io.opentelemetry.sdk.metrics.export.PeriodicMetricReader - Exporter failed
laurit commented 1 year ago

@FrankCy the last thing you posted looks like an user error, you are sending metrics to an endpoint that does not accept metrics. If you don't want the metrics you can disable the metrics exporter. As for the original issue it would be best if you could create a github repo for your sample app that could be easily run. This will ensure that we can see exactly what you see and determine whether what you are seeing is a bug or something else.

FrankCy commented 1 year ago

THK,I will create one now.

FrankCy commented 1 year ago

@FrankCy the last thing you posted looks like an user error, you are sending metrics to an endpoint that does not accept metrics. If you don't want the metrics you can disable the metrics exporter. As for the original issue it would be best if you could create a github repo for your sample app that could be easily run. This will ensure that we can see exactly what you see and determine whether what you are seeing is a bug or something else.

https://github.com/FrankCy/spring-boot-tempo-loki/blob/main/opentelemetry-java/src/main/java/com/tempo/loki/TempoLokiStartApplication.java

The version is 1.28.0, and the startup command is as follows:

java -javaagent:opentelemetry-javaagent-1.28.0.jar -Dotel.resource.attributes=service.name=spring-boot-tempo-loki -Dotel.traces.exporter=otlp  -Dotel.exporter.otlp.endpoint=http://192.168.163.172:4317 -jar opentelemetry-java-1.0-SNAPSHOT.jar

access API

http://localhost:8097/api/v1/hello

console:

2023-07-14 18:32:05.790 [http-nio-8097-exec-3] INFO  - traceId:[] spanId:[] com.tempo.loki.controller.TempoLokiController -- --------- Hello API V1 ----------
2023-07-14 18:32:06.514 [http-nio-8097-exec-8] INFO  - traceId:[] spanId:[] com.tempo.loki.controller.TempoLokiController -- --------- Hello API V1 ----------
2023-07-14 18:32:06.981 [http-nio-8097-exec-6] INFO  - traceId:[] spanId:[] com.tempo.loki.controller.TempoLokiController -- --------- Hello API V1 ----------
2023-07-14 18:32:07.158 [http-nio-8097-exec-4] INFO  - traceId:[] spanId:[] com.tempo.loki.controller.TempoLokiController -- --------- Hello API V1 ----------
2023-07-14 18:32:07.336 [http-nio-8097-exec-9] INFO  - traceId:[] spanId:[] com.tempo.loki.controller.TempoLokiController -- --------- Hello API V1 ----------

There is no data in the temp of grafana.

FrankCy commented 1 year ago

I am doing functional research. I expect to view tempo through grafana. All components are installed and deployed independently. If there are relevant documents or videos, I hope you can provide them.

laurit commented 1 year ago

The way I see it there are 2 issues. Firstly you are not seeing trace and span id in the output. This happens because the pattern in https://github.com/FrankCy/spring-boot-tempo-loki/blob/b35b94f2f38d8886f66b0c40121df6729641272e/opentelemetry-java/src/main/resources/log4j2-spring.xml#L4 is wrong it should be using %X{trace_id} and %X{span_id} instead of %X{traceId} and %X{spanId}. See https://github.com/open-telemetry/opentelemetry-java-instrumentation/blob/1e9b47b4c35f9046cec3718cadbc7410fdd9ffe1/instrumentation/log4j/log4j-context-data/log4j-context-data-2.17/library-autoconfigure/README.md?plain=1#L59 Secondly you are not seeing logs in loki. This is most likely because the logging exporter is disabled by default, you can enable it with -Dotel.logs.exporter=otlp. If you are interested in documentation and videos for tempo and grafana then you are better off asking for them in the respective communities of these projects or from grafana labs. Perhaps @zeitlinger can help with this.

zeitlinger commented 1 year ago

thanks for tagging me @laurit :smile:

@FrankCy we have a complete getting starting guide for OpenTelemetry + grafana and there's a guide how to view OpenTelemetry data in Loki.

FrankCy commented 1 year ago

The way I see it there are 2 issues. Firstly you are not seeing trace and span id in the output. This happens because the pattern in https://github.com/FrankCy/spring-boot-tempo-loki/blob/b35b94f2f38d8886f66b0c40121df6729641272e/opentelemetry-java/src/main/resources/log4j2-spring.xml#L4 is wrong it should be using %X{trace_id} and %X{span_id} instead of %X{traceId} and %X{spanId}. See

https://github.com/open-telemetry/opentelemetry-java-instrumentation/blob/1e9b47b4c35f9046cec3718cadbc7410fdd9ffe1/instrumentation/log4j/log4j-context-data/log4j-context-data-2.17/library-autoconfigure/README.md?plain=1#L59

Secondly you are not seeing logs in loki. This is most likely because the logging exporter is disabled by default, you can enable it with -Dotel.logs.exporter=otlp. If you are interested in documentation and videos for tempo and grafana then you are better off asking for them in the respective communities of these projects or from grafana labs. Perhaps @zeitlinger can help with this.

THK.

FrankCy commented 1 year ago

thanks for tagging me @laurit 😄

@FrankCy we have a complete getting starting guide for OpenTelemetry + grafana and there's a guide how to view OpenTelemetry data in Loki.

THK.

FrankCy commented 1 year ago

The way I see it there are 2 issues. Firstly you are not seeing trace and span id in the output. This happens because the pattern in https://github.com/FrankCy/spring-boot-tempo-loki/blob/b35b94f2f38d8886f66b0c40121df6729641272e/opentelemetry-java/src/main/resources/log4j2-spring.xml#L4 is wrong it should be using %X{trace_id} and %X{span_id} instead of %X{traceId} and %X{spanId}. See

https://github.com/open-telemetry/opentelemetry-java-instrumentation/blob/1e9b47b4c35f9046cec3718cadbc7410fdd9ffe1/instrumentation/log4j/log4j-context-data/log4j-context-data-2.17/library-autoconfigure/README.md?plain=1#L59

Secondly you are not seeing logs in loki. This is most likely because the logging exporter is disabled by default, you can enable it with -Dotel.logs.exporter=otlp. If you are interested in documentation and videos for tempo and grafana then you are better off asking for them in the respective communities of these projects or from grafana labs. Perhaps @zeitlinger can help with this.

Hi,The traceId has been generated, but the data of tempo cannot be found in grafana, and the following error occurs when starting the program. Is this related to the JSK version:

[otel.javaagent 2023-07-17 02:14:23:090 +0000] [OkHttp http://192.168.163.172:4317/...] ERROR io.opentelemetry.exporter.internal.grpc.OkHttpGrpcExporter - Failed to export metrics. Server responded with UNIMPLEMENTED. This usually means that your collector is not configured with an otlp receiver in the "pipelines" section of the configuration. If export is not desired and you are using OpenTelemetry autoconfiguration or the javaagent, disable export by setting OTEL_METRICS_EXPORTER=none. Full error message: unknown service opentelemetry.proto.collector.metrics.v1.MetricsService
[otel.javaagent 2023-07-17 02:14:23:090 +0000] [OkHttp http://192.168.163.172:4317/...] DEBUG io.opentelemetry.sdk.metrics.export.PeriodicMetricReader - Exporter failed
FrankCy commented 1 year ago

There is also the following error

[otel.javaagent 2023-07-17 02:28:00:096 +0000] [OkHttp http://192.168.163.172:4317/...] ERROR io.opentelemetry.exporter.internal.grpc.OkHttpGrpcExporter - Failed to export metrics. Server responded with UNIMPLEMENTED. This usually means that your collector is not configured with an otlp receiver in the "pipelines" section of the configuration. If export is not desired and you are using OpenTelemetry autoconfiguration or the javaagent, disable export by setting OTEL_METRICS_EXPORTER=none. Full error message: unknown service opentelemetry.proto.collector.metrics.v1.MetricsService
laurit commented 1 year ago

There is also the following error

[otel.javaagent 2023-07-17 02:28:00:096 +0000] [OkHttp http://192.168.163.172:4317/...] ERROR io.opentelemetry.exporter.internal.grpc.OkHttpGrpcExporter - Failed to export metrics. Server responded with UNIMPLEMENTED. This usually means that your collector is not configured with an otlp receiver in the "pipelines" section of the configuration. If export is not desired and you are using OpenTelemetry autoconfiguration or the javaagent, disable export by setting OTEL_METRICS_EXPORTER=none. Full error message: unknown service opentelemetry.proto.collector.metrics.v1.MetricsService

This is a configuration issue. By default agent exports spans and metrics. As explained in the error message whatever it is you are sending the data do does not accept metrics. Either disable metrics exporter as described in the error message or consult the documentation of whatever you are sending your data do on how to enable metrics or whether it supports metrics at all.

FrankCy commented 1 year ago

already set: -Dotel.metrics.exporter=none, At the same time log4j2-spring.xml has been configured.

java -javaagent:/data/server/boot_pro/opentelemetry-javaagent-1.27.0.jar \
  -Dotel.logs.exporter=otlp \
  -Dotel.semconv-stability.opt-in=http \
  -Dotel.instrumentation.micrometer.base-time-unit=s \
  -Dotel.instrumentation.log4j-appender.experimental-log-attributes=true \
  -Dotel.instrumentation.logback-appender.experimental-log-attributes=true \
  -Dotel.exporter.otlp.protocol=grpc \
  -Dotel.metrics.exporter=none \
  -Dotel.javaagent.debug=true \
  -Dotel.exporter.otlp.endpoint=http://192.168.163.172:4317 \
  -Dotel.service.name=opentelemetry-java \
  -Dotel.resource.attributes=deployment.environment=dev,service.namespace=test,service.version=1.1 \
  -jar opentelemetry-java-1.0-SNAPSHOT.jar

However, it is still not found in the tempo of grafana. If it is reported through gRpc and the port is set to 4137, how to configure tempo in grafana?

FrankCy commented 1 year ago

WX20230717-152328

Is there any problem with this configuration?

FrankCy commented 1 year ago

Similarly, port 4318 is also configured separately, but there is still no data, although Save&Test did not report an error.

FrankCy commented 1 year ago

Debug log for each request:

2023-07-17 08:00:53.827 [http-nio-8097-exec-3] INFO  - trace_id:[e3f2419ad5f4e30cfe449f3b188f0a07] span_id:[f80be81af2f37aa5] trace_flags:[01] com.tempo.loki.controller.TempoLokiController -- --------- Hello API V1 ----------
[otel.javaagent 2023-07-17 08:00:53:836 +0000] [http-nio-8097-exec-3] INFO io.opentelemetry.exporter.logging.LoggingSpanExporter - 'TempoLokiController.tracking' : e3f2419ad5f4e30cfe449f3b188f0a07 f80be81af2f37aa5 INTERNAL [tracer: io.opentelemetry.spring-webmvc-3.1:1.27.0-alpha] AttributesMap{data={thread.name=http-nio-8097-exec-3, thread.id=28}, capacity=128, totalAddedValues=2}
[otel.javaagent 2023-07-17 08:00:53:837 +0000] [http-nio-8097-exec-3] INFO io.opentelemetry.exporter.logging.LoggingSpanExporter - 'GET /api/v1/hello' : e3f2419ad5f4e30cfe449f3b188f0a07 b10c2e7e4b8eee61 SERVER [tracer: io.opentelemetry.tomcat-7.0:1.27.0-alpha] AttributesMap{data={http.request.method=GET, http.response.body.size=7, http.route=/api/v1/hello, server.address=192.168.163.149, client.socket.port=60529, url.path=/api/v1/hello, network.protocol.name=http, server.socket.address=192.168.163.1, client.socket.address=192.168.163.1, network.protocol.version=1.1, user_agent.original=Mozilla/5.0 (Macintosh; Intel Mac OS X 10_15_7) AppleWebKit/537.36 (KHTML, like Gecko) Chrome/114.0.0.0 Safari/537.36, url.scheme=http, server.port=8097, thread.name=http-nio-8097-exec-3, http.response.status_code=200, thread.id=28}, capacity=128, totalAddedValues=16}
[otel.javaagent 2023-07-17 08:00:53:872 +0000] [http-nio-8097-exec-2] INFO io.opentelemetry.exporter.logging.LoggingSpanExporter - 'ResourceHttpRequestHandler.handleRequest' : c3edcd66304b56d3889f44fed99744d3 de39f77666541344 INTERNAL [tracer: io.opentelemetry.spring-webmvc-3.1:1.27.0-alpha] AttributesMap{data={thread.name=http-nio-8097-exec-2, thread.id=27}, capacity=128, totalAddedValues=2}
[otel.javaagent 2023-07-17 08:00:53:874 +0000] [http-nio-8097-exec-2] INFO io.opentelemetry.exporter.logging.LoggingSpanExporter - 'GET /**/favicon.ico' : c3edcd66304b56d3889f44fed99744d3 f6d8ae2a8e37c012 SERVER [tracer: io.opentelemetry.tomcat-7.0:1.27.0-alpha] AttributesMap{data={http.request.method=GET, http.route=/**/favicon.ico, server.address=192.168.163.149, client.socket.port=60529, url.path=/favicon.ico, network.protocol.name=http, server.socket.address=192.168.163.1, client.socket.address=192.168.163.1, network.protocol.version=1.1, user_agent.original=Mozilla/5.0 (Macintosh; Intel Mac OS X 10_15_7) AppleWebKit/537.36 (KHTML, like Gecko) Chrome/114.0.0.0 Safari/537.36, url.scheme=http, server.port=8097, thread.name=http-nio-8097-exec-2, http.response.status_code=304, thread.id=27}, capacity=128, totalAddedValues=15}
[otel.javaagent 2023-07-17 08:00:53:969 +0000] [OkHttp 192.168.163.172] DEBUG okhttp3.internal.concurrent.TaskRunner - Q10002 scheduled after   0 µs: OkHttp 192.168.163.172 ping
[otel.javaagent 2023-07-17 08:00:53:970 +0000] [OkHttp TaskRunner] DEBUG okhttp3.internal.concurrent.TaskRunner - Q10002 starting              : OkHttp 192.168.163.172 ping
[otel.javaagent 2023-07-17 08:00:53:971 +0000] [OkHttp TaskRunner] DEBUG okhttp3.internal.concurrent.TaskRunner - Q10002 finished run in 401 µs: OkHttp 192.168.163.172 ping
[otel.javaagent 2023-07-17 08:00:53:973 +0000] [OkHttp http://192.168.163.172:4317/...] DEBUG okhttp3.internal.concurrent.TaskRunner - Q10001 scheduled after   0 µs: OkHttp ConnectionPool
[otel.javaagent 2023-07-17 08:00:53:976 +0000] [OkHttp TaskRunner] DEBUG okhttp3.internal.concurrent.TaskRunner - Q10001 starting              : OkHttp ConnectionPool
[otel.javaagent 2023-07-17 08:00:53:976 +0000] [OkHttp ConnectionPool] DEBUG okhttp3.internal.concurrent.TaskRunner - Q10001 run again after 300 s : OkHttp ConnectionPool
[otel.javaagent 2023-07-17 08:00:53:977 +0000] [OkHttp TaskRunner] DEBUG okhttp3.internal.concurrent.TaskRunner - Q10001 finished run in 987 µs: OkHttp ConnectionPool
[otel.javaagent 2023-07-17 08:00:53:977 +0000] [BatchLogRecordProcessor_WorkerThread-1] DEBUG io.opentelemetry.sdk.logs.export.BatchLogRecordProcessor$Worker - Exporter failed
[otel.javaagent 2023-07-17 08:00:55:672 +0000] [OkHttp 192.168.163.172] DEBUG okhttp3.internal.concurrent.TaskRunner - Q10006 scheduled after   0 µs: OkHttp 192.168.163.172 ping
[otel.javaagent 2023-07-17 08:00:55:673 +0000] [OkHttp TaskRunner] DEBUG okhttp3.internal.concurrent.TaskRunner - Q10006 starting              : OkHttp 192.168.163.172 ping
[otel.javaagent 2023-07-17 08:00:55:673 +0000] [OkHttp TaskRunner] DEBUG okhttp3.internal.concurrent.TaskRunner - Q10006 finished run in 502 µs: OkHttp 192.168.163.172 ping
[otel.javaagent 2023-07-17 08:00:55:674 +0000] [OkHttp http://192.168.163.172:4317/...] DEBUG okhttp3.internal.concurrent.TaskRunner - Q10000 scheduled after   0 µs: OkHttp ConnectionPool
[otel.javaagent 2023-07-17 08:00:55:674 +0000] [OkHttp TaskRunner] DEBUG okhttp3.internal.concurrent.TaskRunner - Q10000 starting              : OkHttp ConnectionPool
[otel.javaagent 2023-07-17 08:00:55:675 +0000] [OkHttp ConnectionPool] DEBUG okhttp3.internal.concurrent.TaskRunner - Q10000 run again after 300 s : OkHttp ConnectionPool
[otel.javaagent 2023-07-17 08:00:55:675 +0000] [OkHttp TaskRunner] DEBUG okhttp3.internal.concurrent.TaskRunner - Q10000 finished run in 628 µs: OkHttp ConnectionPool
zeitlinger commented 1 year ago

Have you tried following https://grafana.com/docs/opentelemetry/instrumentation/java/javaagent/ - including Grafana agent ?

Or, if you run tempo manually, configure the grpc address as described here?

Also, feel free to reach out on the Grafana community support slack (#opentelemetry).

FrankCy commented 1 year ago

THK.You can already see the link log, although there are still some things I don’t understand, thank you very much.