Closed tim2000s closed 7 years ago
I have been using the referenced Novorapid (Novolog) curves, using Humalog insulin and dia=5, live for about 12h and have found a much better correlation with observed data over the last 2 weeks than I had with the old formulas. My modification to calculate.js, based on Tim's work, is available here: https://gist.github.com/mgranberryto/e5116dbc314cdf78513f4d185684b8a5
My branch is at https://github.com/sulkaharo/oref0/tree/fiasp
Added an unit test, too. Will add more soon
I'm running on the Fiasp curve successfully now for a couple of hours. Will report back when run for a longer duration. So far so good.
Been running the Fiasp curve for the best part of a day now with a five hour DIA. It's definitely working more effectively than the older shape curve, and has the added benefit of not missing the tail and having the resultant stacking. All in all an effective change for me.
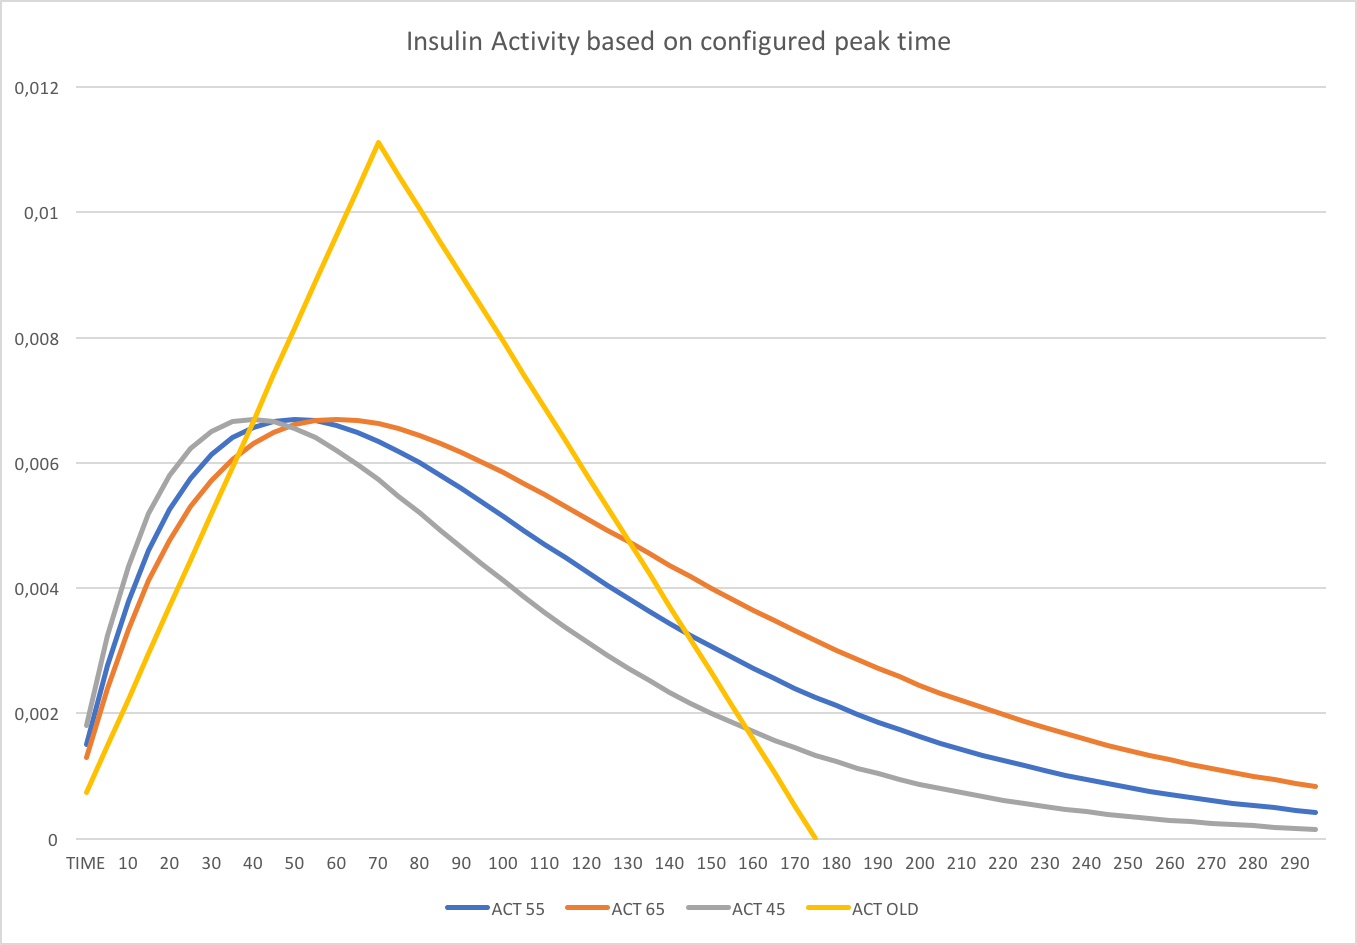
Just pushed a new version of my brach, which adds customizing the peak time OR DIA for Fiasp. See attacked graphs for what IOB and activity curves look at 45, 55 and 65 minute settings. Note the old bilinear model calculated a LOT more activity for insulin at peak, included a reference graph for 3 hour DIA.
I have a problem with the use of the function t^n \exp(-n*t/ \tau) where n is a non-integer. I originally suggested that type of function as it is the response of a second/third order linear system with repeated roots to an impulse with 0 initial conditions. Such systems are commonly used to model insulin action.
When n is not an integer we loss integrability of the function and it ceases to be a solution to the system. It is just a function that seems to fit the data. I would prefer to use a linear combination of: $a t \exp(-t / \tau) + b t^2 \exp(-t / \tau)$ instead of $n=1.5$ to better fit the novorapid data.
Why does that matter? Isn't data fit the only concern at the end of the day?
Yes, the fit is the most important part. And I think this is a big improvement on the old function.
However, there is a lot of literature backing the use of second and third order systems to fit insulin data. These systems are usually fit on data sets with large numbers of samples. By being consistent, I think, we're more likely to have a model that works for the largest number of people in the largest number of cases.
To me, n=1.5 seems an arbitrary choice based off one data set. We also want integrability to find IOB data. I think we could acheive just a good a fit from a function that is consistent with the underlying theory and have the added benefit of integrability and easier to understand parameters.
Pardon my mathematical ignorance: Is there some fundamental sense in which you can't take the integral of an exponential function unless the exponent is an integer?
I'd be fine with linearly combining the two functions to achieve approximately the same result if that makes the math easier.
@tepidjuice and @sulkaharo : do you already see some impact on better blood glucose values and/or less glucose variability? Or is to early to say something of the effect of the new formulas?
Keep up the good work. If there is something I can help to bring this forward, please let me know.
You can take the integral but it doesn't have a closed form. But I think it's also important to be consistent with the theory. To summarise most models of insulin action look like atexp(-t/\tau) + b*t^2 \exp(-t / \tau) or similar. These models have been widely tested so I think there is benefit in being as close to them as is feasible. For example, what if there's something particular about the data set that was used to get n=1.5?
@PieterGit I think this is a big improvement in insulin modelling for openaps. I couldn't say anything about improved results but I like the smaller peak and extended tail.
I think this discussion misses the point. The best fit curves are derived from a set of glucose clamp data that is presented from a decent sample size. Whilst it appears as "one data set" it's not as though it's one individual.
Speaking from a personal use case perspective, it's significantly better than what was in place previously with using Fiasp and has mitigated the missing tail loading I was seeing with the older curve. And the five hours DIA does seem realistic from my use experience.
I think one of the issues we have is that there is a massive tendency to underestimate the longevity of insulin in the system, mostly as an emotional response to not seeing much effect, when the physiological reality is that it lasts a lot longer.
Morning ;) quick Q: my looping endo Frank @efbest was asking me about the new Fiasp curves and he would like to test, what, where (repo) needs to be done for testing? Thanks!
It's too early to say definitely. Early signs are good though! Sadly our current sensor is noisier than usual, so I can't give out any meaningful variability metrics. Time on range & projected A1C are extremely good so far. I'll post instructions on what to test / what the settings are tomorrow.
I want to chime in on the non-Fiasp use case. I have been running with the unscaled formula (a DIA of 5h), and have had very good results for 2/3 days. The first day was one of my worst in months, probably due to poor insulin absorption at a new pump site and insulin suddenly absorbing 6h after changing the site out.
For the other days, my overnight lines have been completely flat about +/- 3 mg/dl from target. Daytime results have been good, but UAM is now too conservative and I would usually do better with more insulin delivered earlier for protein rises. Eggs in particular lead to poorer results now than they did before, but lows don't seem to be a concern either. My loop previously had a tendency to overcorrect at times and oscillate wildly after large meals and I am now seeing a reasonably quick and stable return to target.
I've been wading through this discussion as well as the one on Loop issue 388. One thing I notice is that people are mixing insulin concentration curves and insulin action curves. If the y axis is a concentration (eg pmol/L or microunits/ml), then it is a concentration curve measured in a blood draw. If the y axis units are glucose disposal (eg mg/kg/min), then these are insulin action curves typically measured in a clamp study.
Examples of both curves for Novolog vs Fiasp can be found in this document The concentration curves are on page 26, action curves on on 34.
@rdsteed I hasn't realized that Medtronic "defines the DIA as when 10% of insulin action remains". That actually makes quite a bit of sense, and might be a good way for us to proceed as well: calculate when 10% of IOB remains on our exponential curves and report that as DIA.
With regard to insulin action as a function of glucose concentration, isn't that effect counteracted by the increased resistance / decreased sensitivity seen with high BG, such that on net it takes proportionally more insulin to bring BG down from 300 to 200 than from 200 to 100?
@scottleibrand No, simply having a high BG does not directly cause insulin resistance. But things are seldom simple.
So, all things being equal, insulin action (defined as rate of glucose disposal) increases as BG rises. The caveat is that in human physiology, all things are seldom equal.
@rdsteed With both starting from 0 COB and 0 IOB, it can often take more insulin to drop BG from 300 to 200 than 200 to 100.
While it may not technically be because of insulin resistance, I can correct a BG of 350 using the same ISF as I would with a lower BG and not end up in the target range (when I would if I correct from, say, 200).
@cjo20 It can seem paradoxical.
My answer to you is that if you have a BG of 350 one day and 200 the next day with the same 0 COB and 0 IOB, then on the 350 day, you are significantly more insulin resistant than you are on the 200 day.
The godfather of insulin resistance / syndrome X etc is Gerald Reaven. He is now 89 years old, but in his heyday as researcher 50 years ago, he did the seminal work in the field of insulin resistance. He devised an amazingly simple testing protocol where fasting individuals were given an infusion to shut down insulin production. He then infused a fixed amount of insulin and glucose (adjusted for body size). After 3 hours, the subjects reached a steady state BG. The people most sensitive to insulin had the lowest BG's, and the people with the most resistance to insulin had the highest BG's.
With type 1 diabetes, you don't have to give an infusion to shut down insulin production by the body. If you have a constant basal but are running higher than you usually would, then you are, in most respects, reproducing the original test that defined insulin resistance. It isn't at all surprising that on a day of high insulin resistance, you would need much more insulin to put yourself into the target range.
Of course, on the days you run 350, it may not be true insulin resistance but a bad site or bad insulin mimicking insulin resistance. Again, it's not at all surprising in these cases that a correction dose won't work very well.
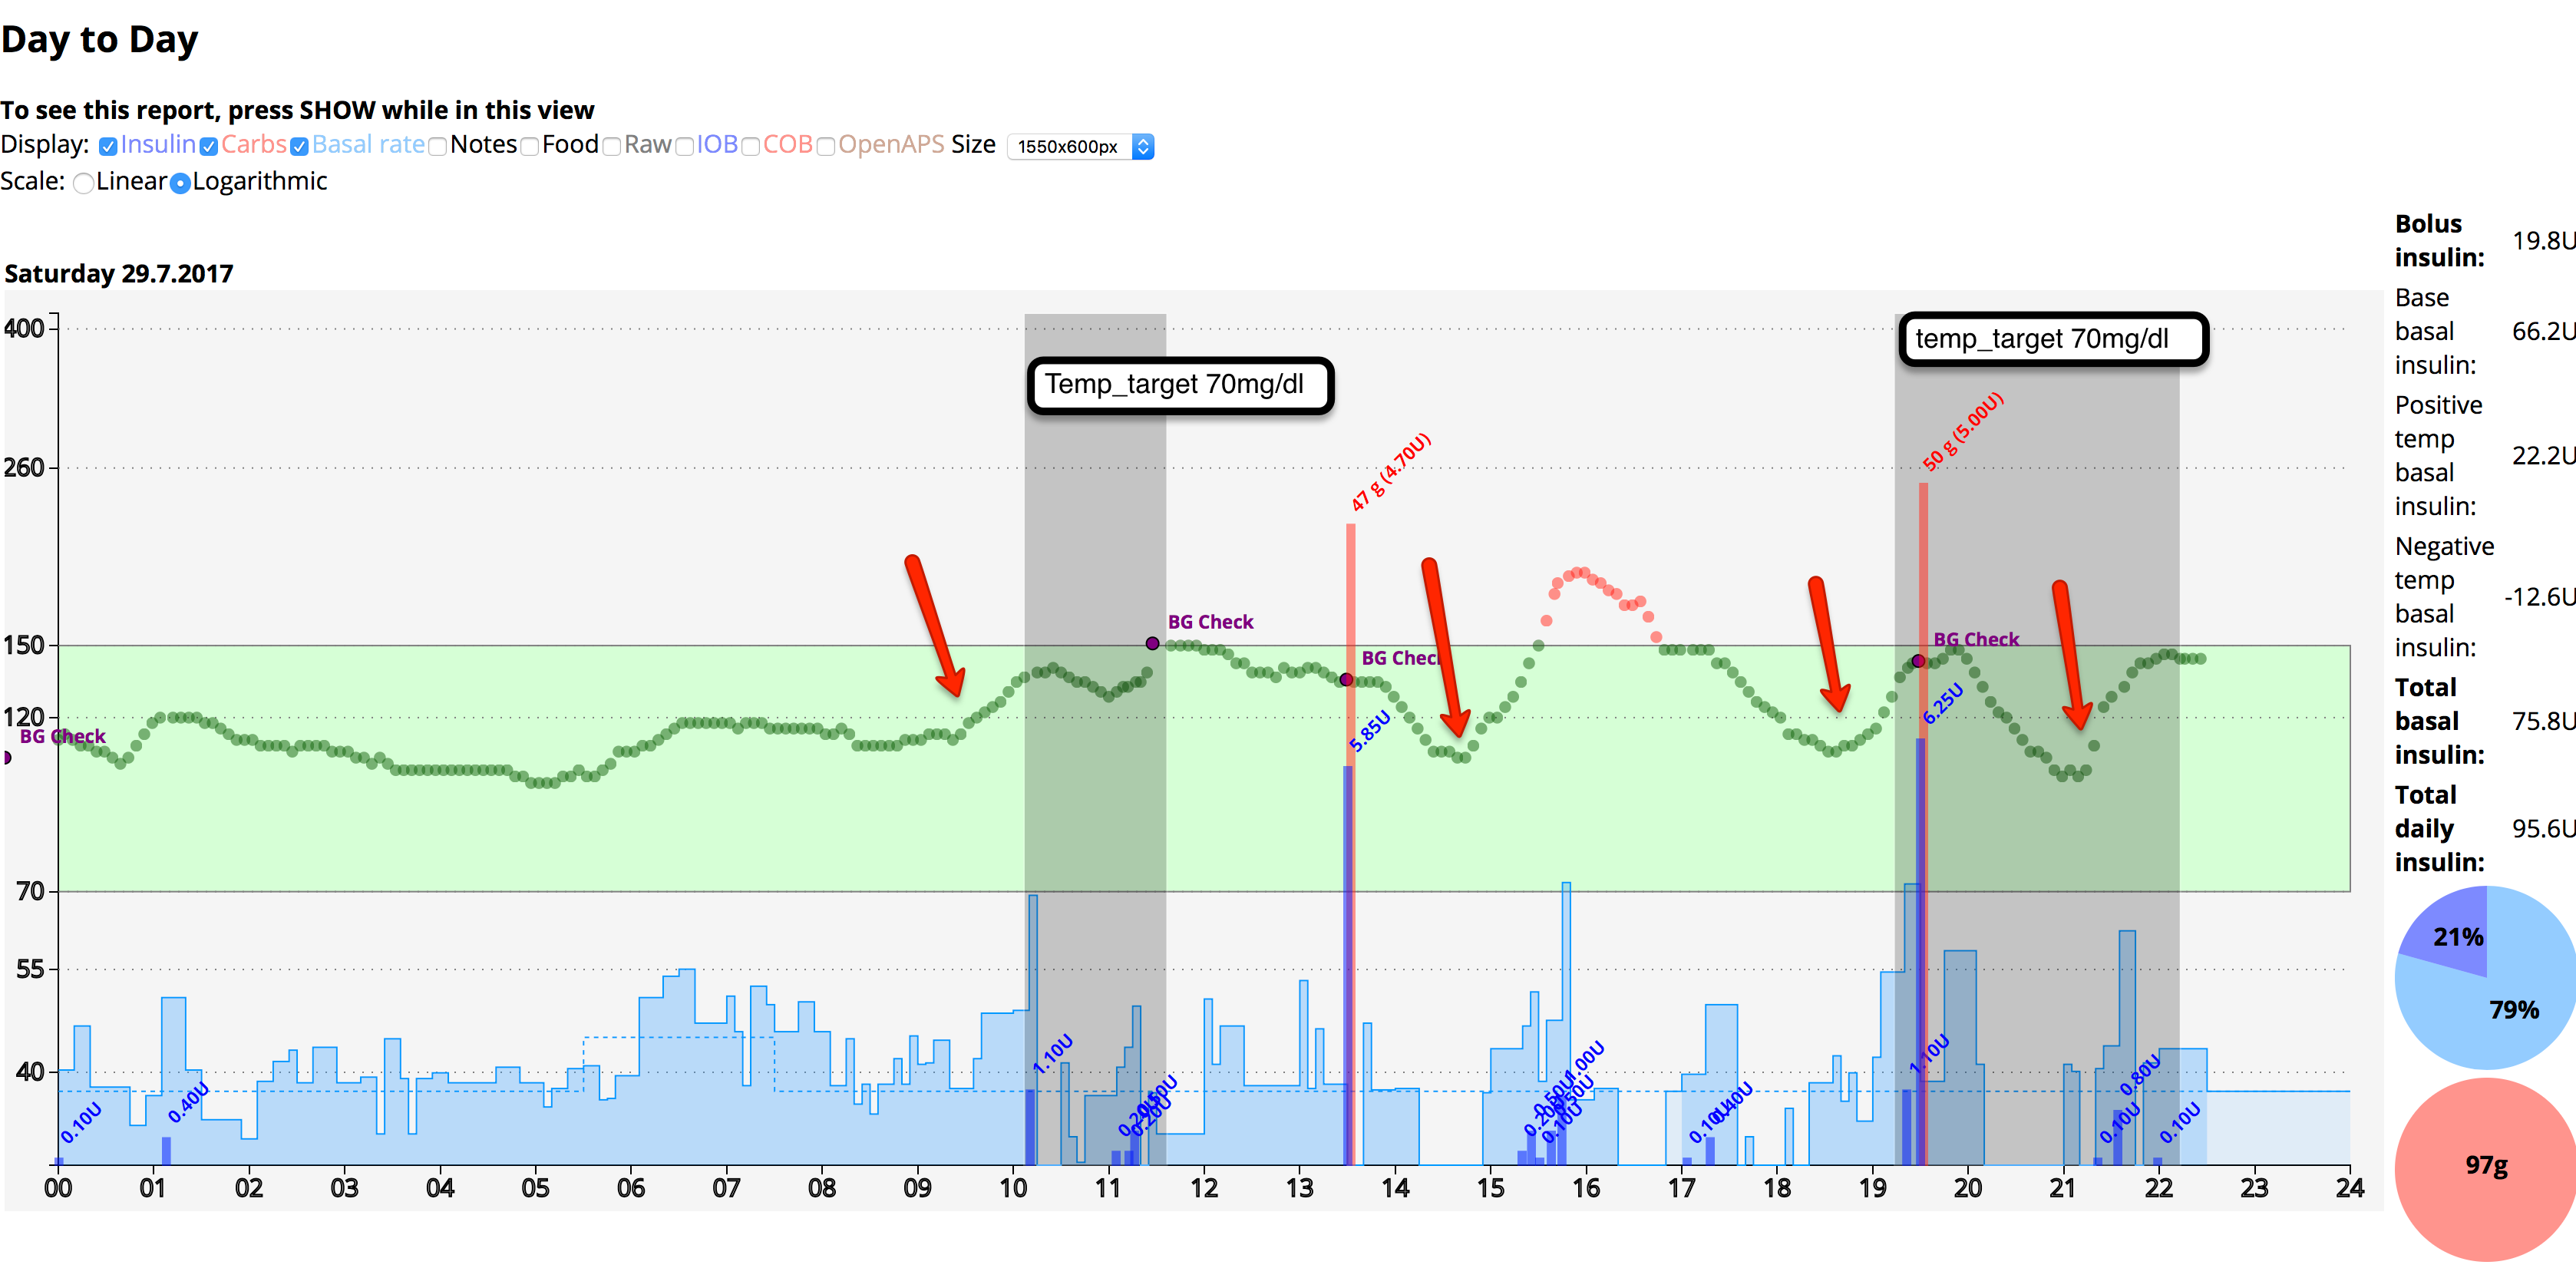
@rdsteed is totally right that it's necessary to differentiate between insulin concentration and insulin action! In that respect the algos need some optimization: Today is day 4 using Fiasp and Exponential_curves. My experience is similar to what happened in April using Fiasp and bilinear curves: when BG is rising the algo kicks in too late and when BG is (slightly) decreasing Low_temp starts to early, especially after meals. And that looks like the algo is neglecting set BG targets completely! My total daily insulin has gone up by 30%, ISF decreased from 29 to 22, mean BG increased from 105 to 118mg/dl. Using insulin apart (Novolog, NovoRapid) I needed no lead time between bolussing and eating; under Fiasp I waited 40 minutes and could't prevent an BG increase (see attached graph).
I definitely think the algos need optimization for other insulins!
@efbest did you just switch back to Fiasp? Our (and multiple others) have experienced it takes at least a couple weeks for the body to stabilize on Fiasp. For us, a resistence period started on the fourth day and it took four days for things to stabilize, the another week to reach the current predictable state. So for anyone who've been on Fiasp for less than 2 weeks, my assumption the issue is the body reacting unpredictably to insulin and people making the switch will have to bear it for some time. Any information as to why people experience a period of instability when adopting Fiasp are welcome.
@efbest You are describing behaviour with Fiasp that reflects what I know a lot of people have seen that aren't using a loop, namely that their insulin requirements increase along with a reduction in sensitivity. That seems consistent across many people (but not all) using Fiasp in CSII.
I get the impression that you were quite rare in not needing to bolus in advance when using Novorapid. I've not heard that from many people.
I don't think four days with Fiasp is really long enough to draw conclusions though. It took a month for me to reach stability.
Sorry if this is the wrong place to repost this. I made this comment: https://github.com/LoopKit/Loop/issues/388#issuecomment-318975664 on https://github.com/LoopKit/Loop/issues/388
I think implementing the equations directly has many advantages over the proposed exponential curves e.g. it's computationally simpler, more flexible and more accurate.
Shall we close this as complete now that it's in dev?
Enhancement to iob/calculate.json to use real curves and allow a choice between Fiasp and standard fast acting during set-up.
The curves are available at https://github.com/LoopKit/Loop/issues/388
Potential issues include variation in peak time when scaling curves by DIA and when to cut off action.
Also question whether we should have standard curves by default and require an enable flag to swap those out for fiasp or whether it should be included in the interactive setup.
I'll submit a branch to allow users to test my Fiasp curves once tested over the weekend, but no setup configuration work has yet been done.