openeemeter / caltrack

Shared repository for documentation and testing of CalTRACK methods
http://docs.caltrack.org
Creative Commons Zero v1.0 Universal
56 stars 14 forks source link

Specify maximum baseline and reporting period lengths #68

Closed hshaban closed 6 years ago

hshaban commented 6 years ago

Minimum baseline and reporting period lengths are defined in Caltrack’s data sufficiency requirements, but using long baseline/reporting periods results in significantly different model fits than constrained periods (due to naturally occurring savings, non-routine events etc.)

We propose setting a limit on the data included in the baseline and reporting periods: 12-months for daily data and 24 months for monthly data.

steevschmidt commented 6 years ago

HEA has found that 18 months of daily data is optimal for heating and cooling regressions. This amount provides more accuracy than just 12 months, but does not overwhelm recent trends (a risk with longer periods).

mcgeeyoung commented 6 years ago

Interesting. It's a little counterintuitive to select 18 months (given the likelihood of over-fitting to which ever season gets counted twice). Do you have test results that show why 18 months yields better results?

jskromer commented 6 years ago

Is any thought given to known or predicted variations in operational characteristics? For example, if you know that the building operation/schedule was recently changed, you probably wouldn't want to include the data from before the change. (you'd need to do a preemptive non-routine adjustment) One would prefer to have data on the operational modes that one expects to see in the reporting period.

danrubado commented 6 years ago

Energy Trust's view is that data should be selected in increments of 12-months so that a seasonal bias is not introduced when fitting the model, as pointed out by McGee. We also have a preference for limiting the baseline and reporting periods to the 12 months of data closest to the treatment period to limit the impact of factors unrelated to the treatment, as noted by Hassan. You may get better fit statistics using 24 months of data, but it may not represent the pre-retrofit conditions as closely. A longer time series may contain a blend of current and past physical and operational conditions at the site.

hshaban commented 6 years ago

Proposed test methodology:

Acceptance criteria:

hshaban commented 6 years ago

TEST RESULTS

Background The length of the baseline and reporting periods that are included in the savings models may affect results in two ways:

It is generally agreed that a minimum 12 months of data should be used in order to capture at least one annual cycle of energy use. However, there are no general guidelines about the maximum length of time to include in savings analysis.

Dataset Billing data from 1000 residential buildings in Oregon and daily data from 1000 residential buildings in California.

Tested parameters The Caltrack methods were applied to the full datasets five times, only varying the length of the baseline period that was used to fit the models- between 12 and 24 months in 3-month increments.

Results Figure 1 shows that the estimated normalized consumption is clearly proportional to the baseline period length for daily data. Figure 2 demonstrates that with increasing period length, the model fits, represented by R-squared, tend to get worse. This is likely because of the second effect pointed out above (greater likelihood of non-routine events that affect energy use). This monotonic increase in baseline energy use for program participants may drive an increase in estimated savings. This is an indication that the rate of naturally occurring savings in this sample may affect results when longer time periods are used for analysis. Therefore, it appears preferable to use a maximum of 12 months of data for analysis, especially with the availability of daily data.

image Figure 1. Effect of baseline period length on normalized annual consumption using daily data.

image 
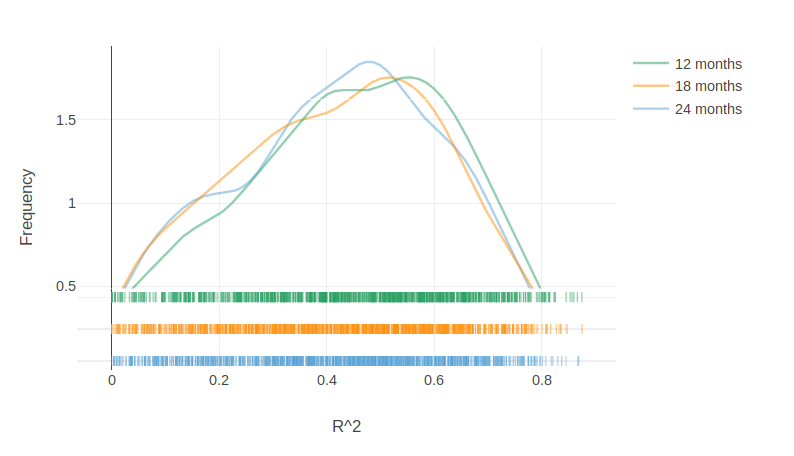
Figure 2. Effect of baseline period length on model R-squared distribution. Model fits get poorer with increasing baseline period length.

When the same test was applied using billing data, no monotonic trends were obvious in the normalized annual consumption, however, the normalized annual consumption showed cyclical trends, likely corresponding to the model being weighted towards the seasons with more data. The 24-month baseline model produced a normalized estimate that was slightly higher than the 12-month baseline model.

image Figure 3. Effect of baseline period length on normalized annual consumption using billing data. Y axis (Baseline Normalized Annual Consumption) is in percent.

Recommendations

We recommend limiting the maximum baseline period length to 12 months of consumption data for both billing and daily models.

hshaban commented 6 years ago

Adding some more clarification to the choice of a 12 month baseline period based on stakeholder input: The results above are dataset-specific and do not reflect generally expected trends in estimated baseline vs. baseline period length (e.g. estimated baseline energy use will not necessarily increase if a longer baseline is used). However, they do strongly indicate that the predicted baseline may be unstable with different baseline period lengths, which may, in turn, affect calculated savings. A choice must be made by the analyst as to how long this baseline period should be. We are recommending that this choice be limited by setting the maximum baseline period at 12 months, since the year leading to the energy efficiency intervention is the most indicative of near-term energy use, making it amenable to calculating savings in pay-for-performance scenarios.

hshaban commented 6 years ago

This update has been integrated in CalTRACK 2. Closing this issue