 m-kuhn
commented
6 years ago
m-kuhn
commented
6 years ago This is a great proposal.
There are different approaches to this. Either offering static images or a dynamic interactive approach.
Static
A static image approach could be done as part of QFieldSync to generate an image on export.
Dynamic
A dynamic approach could be based on QML.
A simple example taken from the Qt docs
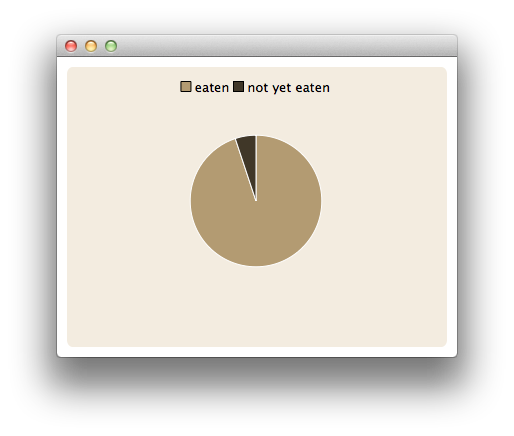
could be defined in the form definition of QGIS something like
import QtQuick 2.0
import QtCharts 2.0

ChartView {
    width: 400
    height: 300
    theme: ChartView.ChartThemeBrownSand
    antialiasing: true

   // Expression based value
   QgisExpression {
       id: notYetEaten
       expression: '1 - "eaten"'
       feature: feature
   }

    PieSeries {
        id: pieSeries
        PieSlice { label: "eaten"; value: fields.eaten } // Integration of fields
        PieSlice { label: "not yet eaten"; value: notYetEaten.value }
    }
}
Notes
- This could be integrated into QGIS forms the very same way (with QGIS 3). Imagine a tab on the attribute form with a schematic painting of a manhole.
- Custom interactions (panning, zooming, popups, etc) are possible, so this is a huge step towards customiozed feature forms in QField
- This is not limited to the QtCharts module, this can be used to build whatever diagrams based on Shape Path, Text or the plenty of other QML modules available.
This is not an issues but a suggestion for enhancement. What do you think of calling for a drawing software when a diagram is needed on field?
In my company we work on Water and Sanitation networks and often a photo is not enough to represent a manhole / Chamber as we hardly see the inlet / outlets. With QGIS we found a way to represent the inflow / outflow directions with checkboxes and lists (e.g. toward down, toward down, toward left, etc.) but it becomes more difficult when we have to add details such as valves, pressure meters, etc.
I would be happy to partially contribute financially on this improvement if other people think it is useful. It could be combined to a list of symbols related to the job of the technician (e.g. electrical diagrams, water valves, road signs,etc.)