 jtweeder
commented
6 years ago
jtweeder
commented
6 years ago I think I have found the place this is happening, or not happening. Bar and barh both work with the labels as above, but lineplot and areaplot (subclass of lineplot), both do not. For bar and barh the xtick labeling happens in _post_plot_logic which has the following (this is not in lineplot _post_plot_logic).
        ...
        if self.use_index:
            str_index = [pprint_thing(key) for key in data.index]
        else:
            str_index = [pprint_thing(key) for key in range(data.shape[0])]
        name = self._get_index_name()

        self._decorate_ticks(ax, name, str_index)

    def _decorate_ticks(self, ax, name, ticklabels):
        ax.set_xticks(self.tick_pos)
        ax.set_xticklabels(ticklabels)
        if name is not None and self.use_index:
            ax.set_xlabel(name)
I have it changed and working locally in the lineplot class when using the df.plot.area and df.plot.line with this toy example as above. Wanted to pass that information to smarter minds for review before proceeding with a PR.
 ImportanceOfBeingErnest
 jorisvandenbossche
 user1493
 anordin95
 TechTarun
 ajsharma22
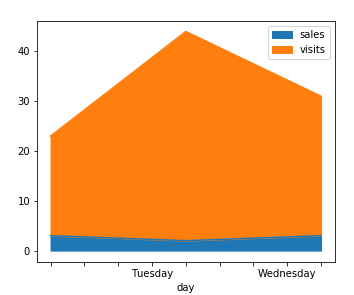
From https://github.com/pandas-dev/pandas/pull/22307#pullrequestreview-145585750: when specifying the x labels in one of our plotting calls where this consists of strings, nothing is shown on the x labels:
The same is true for line plot, for bar plot it does work.
Related to https://github.com/pandas-dev/pandas/issues/18687 (but not exactly the same), and potentially https://github.com/pandas-dev/pandas/pull/18726. I would have expected that there is already an issue for this, but didn't directly find it.