 bradyrx
commented
5 years ago
bradyrx
commented
5 years ago @aaronspring, in what case would the 'lower' flag be useful in your current version of the function?
Closed bradyrx closed 3 years ago
bradyrx
commented
5 years ago @aaronspring, in what case would the 'lower' flag be useful in your current version of the function?
 aaronspring
commented
5 years ago
aaronspring
commented
5 years ago Lower flag when using distance-based metrics like mse rmse which are Perfect if 0 and are positively unbounded. Then the threshold is a lower limit. If skill is above then not significant. Contrary for acc is default. Have a look at my notebook to understand the way this function works. I bootstrap from an uninit. Ensemble and take a threshold (mostly 95% or 99%) as .quantile(.95) for acc or .quantile(.05) for distance metrics. This way the significance is inside the threshold value.
I see your point that you want to have some ci to accept or reject that the skill is better or worse than persistence for example. Do you see a way to include rmse into that framework?
aaronspring
commented
5 years ago I think we have two different approaches of significance here. Let’s put both in. Maybe you find a way to make your approach applicable to rmse, mse, mae.
aaronspring
commented
5 years ago I follow Goodard et al 2012 Clim Dyn (2013) 40:245–272 DOI 10.1007/s00382-012-1481-2
Appendix 2. although strictly speaking I should even shuffle my control. Now bootstrap pm function uses block bootstrapping, see https://en.wikipedia.org/wiki/Bootstrapping_(statistics)?wprov=sfti1
bradyrx
commented
5 years ago The 'lower' flag makes sense now when you want your initialized ensemble to be "lower" than uninitialized (i.e. less error).
I see your point that you want to have some ci to accept or reject that the skill is better or worse than persistence for example. Do you see a way to include rmse into that framework?
I don't see how to make this work in the current framework. There isn't a p-value associated with RMSE/MAE so it's not the same concept as above. Personally, I would always define my predictability horizon by pearson-r, since I can do a direct statistical significance test (as outlined in this issue). This tells me the ACC-based skill of my system -- does it predict positive anomalies when they're positive and negative when they're negative? I would then present RMSE/MAE in the paper separately as a storyline about how close to reality it is; given the skill it has, does it get the absolute values reasonably right?
I'll try to implement this tomorrow if I can and will look at your source. I'll be out of town tomorrow afternoon through the weekend though.
aaronspring
commented
5 years ago I think you should definitely add this to the package. there is different ways to assess significance.
bradyrx
commented
5 years ago Being addressed in https://github.com/bradyrx/climpred/pull/49
aaronspring
commented
5 years ago I'd like to re-open with low prio.
Two papers I got from Leo about significance: (Didnt read yet, but for next weeks journal club)
EDIT: that’s generally on significance of maps. Unsure about this.
RMSE testing:
bradyrx
commented
5 years ago Thanks for adding this. I definitely want to move it away from the compute_reference and into a few horizon scripts with wrappers. I think this is a fairly decent undertaking to do this right. We need to think about various horizon definitions: ensemble mean signal, ensemble spread, etc. as well as RMSE significance vs. pearson r significance.
bradyrx
commented
5 years ago From @aaronspring in https://github.com/bradyrx/climpred/pull/165.
when we re-create this - for future reference @bradyrx . its much easier to just get the latest non-nan value from a dataarray even if some grids contain all nans. no masking needed
ph = skill.argmin('time',skipna=False)
aaronspring
commented
5 years ago this is just a very basic feature which determines the last non-nan argument.
prediction_horizon should use this and can use different approaches:
bradyrx
commented
5 years ago bradyrx
commented
5 years ago A python implementation of MD: https://github.com/johntwk/Diebold-Mariano-Test
aaronspring
commented
5 years ago ph = skill.argmin('time',skipna=False)
This only works for timeseries.
The way I use it now for maps and skill is already of style, skill = init.where(p<.05), eg. masked where not significant.
def ph_from_skill(skill):
    ph = skill.argmin('lead', skipna=False)
    ph = ph.where(ph != 0, np.nan)
    ph_not_reached = (skill.notnull()).all('lead')
    ph = ph.where(~ph_not_reached, other=skill['lead'].max())
return phI'm using DM for the paper I'm writing right now. Here's a gist that puts it together, somewhat sloppily. But it can be used as a template for when we put it into climpred. https://gist.github.com/bradyrx/058ceb84373bffcf61ac2bad4d912b0b
This is adapted from https://github.com/johntwk/Diebold-Mariano-Test/blob/master/dm_test.py, which is MIT license so that's fine.
What I don't fully understand is the "h-step" (see https://pdfs.semanticscholar.org/73a1/2c67d36044035f452a31433a2a759fdffec6.pdf).
You can see it in L150-L151 in the above linked Diebold-Mariano-Test. I tried using this with our true lags, but it resulted in way too low of p-values for what I was testing. Keeping h fixed at one for no matter what our lag is gave me more realistic results. Also MSE seems to be the only metric that is reasonable.
Here's a test between CESM-DPLE (initialized) and CESM-LENS (unintialized). This is MSE for pH for some region. The gray lines show where DM test claims they aren't statistically different (I agree by eye). If you use h as the lag at each step, it comes back that all are significantly different. Same for if you use RMSE or MAE. But the Diebold-Mariano-Test doesn't use either of those, so there might be a reason why...

bradyrx
commented
5 years ago Here's the code used to call the custom dm function I made.
# hind is some post-processed CESM-DPLE
# reference is the FOSI reconstruction

from climpred.utils import reduce_time_series
nlags = hind.lead.size
forecast = hind.rename({'init': 'time'})
forecast, reference = reduce_time_series(forecast, reference, nlags)
plag = []
dmlag = []
for i in forecast.lead.values:
    # DPLE forecast
    fct1 = forecast.sel(lead=i).drop('lead')
    fct1['time'] = [t + i for t in fct1.time.values]

    # Target
    target = reference.sel(time=fct1.time.values)

    # Persistence forecast
    fct2 = reference.sel(time=fct1.time.values-i)

    # DM test
    dm, p = project.dm_test.dm_test(target, fct1, fct2,)
    dmlag.append(dm)
    plag.append(p)
DM = xr.concat(dmlag, 'lead')
pval = xr.concat(plag, 'lead')
DM['lead'] = forecast.lead.values
pval['lead'] = forecast.lead.valuesYour implementation looks much nicer eg easier to read. Never read the MD paper. Will give it a try the next days. Haven’t seen this implemented also. I have mostly seen an F-Test when variances are compares as in mse
bradyrx
commented
5 years ago Let me know if you make better sense of the h-step (or k-step as it's called in some papers). Also if we need to adapt the score based on metric used. It seems like only MSE works here. The python package only allows MSE, MAD, and MAPE. There might be a reason why.
aaronspring
commented
5 years ago How did we come up mentioning the MD test? Have we seen this in any climate paper or only economics? Don’t really understand the h step but I played around with stat. predictions from stat models OLS and they also had these 1 step ahead forecasts which might be this k. In this sense our models are different because we look more timesteps into the future... but this is just guessing
bradyrx
commented
5 years ago I think we discovered it while searching for significance tests for RMSE, etc. Here's a paper on wind energy forecasting that uses it: https://pdfs.semanticscholar.org/ca5f/a429b84df43d67bf13e715db4bea40373a71.pdf. And one on probabilistic forecasting (that mentions climate applications) https://www.annualreviews.org/doi/full/10.1146/annurev-statistics-062713-085831
aaronspring
commented
5 years ago I just stumpled over this prediction paper and they explain Mariano Dieboldt 1995 in the appendix. DOI 10.1175/MWR-D-18-0187.1 maybe this helps
aaronspring
commented
5 years ago Reimplementation suggestion:
aaronspring
commented
4 years ago I think this should be a very generic function. get some criterion as input and then just do some kind .argmin('lead') and properly masking nans.
Currently,
xr_predictability_horizonis a simple test for finding the lead time to which the initialized skill beats out persistence/uninitialized.However, it does not account for two forms of statistical significance: (1) Need to check first that the skill of the initialized prediction (pearson correlation coefficient) is significant (p < 0.05 for example). (2) Need to then check the point to which the initialized skill is significantly different from the uninitialized skill. You first do a Fisher r to z transformation so that you can compare the correlations one-to-one. Then you do a z-score comparison with a lookup table to seek significance to some confidence interval.
Fisher's r to z transformation:
z-comparison: https://www.statisticssolutions.com/comparing-correlation-coefficients/
z-score thresholds for different confidence levels: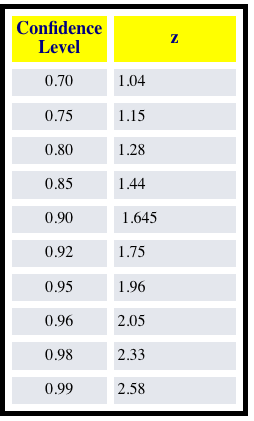
I've written up this code in my personal project, so I just need to transfer it over to the package: