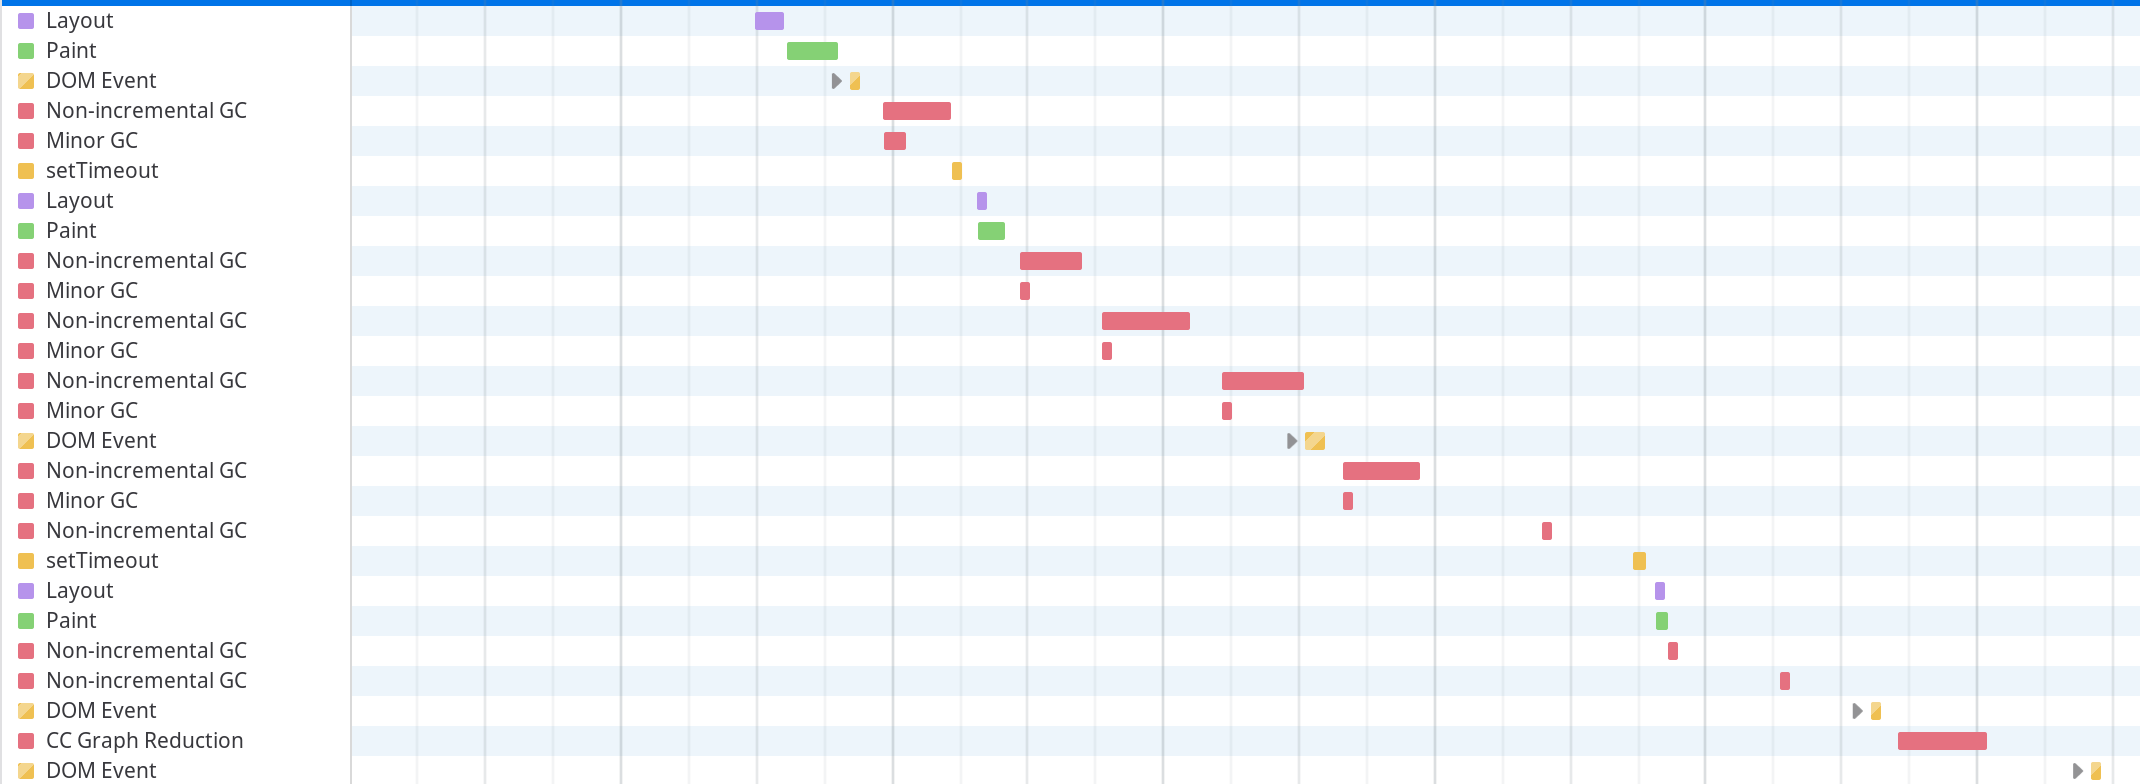
That's pretty curious, it's definitely built to withstand that. It's already only rendering the rows in the list that are within the viewport, so that shouldn't be a problem with the number of nodes. 99% it's a memory leak/bloat, those are always fun in JS :P, I'll see what I can do.

For Kusama with ~150 nodes reporting to the dashboard by default, it keeps freezing my Firefox 68.0.1 (64-bit) on Archlinux after running it a couple of hours.
Maybe it's worth investigating some kind of filters, i.e., only show the top 50 nodes with lowest latency.
ref https://github.com/paritytech/polkadot/issues/416