 piccolbo
commented
4 years ago
piccolbo
commented
4 years ago My guess this is related to altair 4. What is your expected behavior (besides the discrepancy with the docs which is unquestionable)?
Closed johngillece closed 4 years ago
piccolbo
commented
4 years ago My guess this is related to altair 4. What is your expected behavior (besides the discrepancy with the docs which is unquestionable)?
piccolbo
commented
4 years ago My interpretation here is that the fill of the blocks should be colored, the rest black. If you see examples in literature that deviate from this or have other supporting arguments for other colored elements, please let me know. Fix is in master, can you test? Please reopen if anything is wrong.
 johngillece
commented
4 years ago
johngillece
commented
4 years ago It worked. Consider it closed.
import pandas as pd import matplotlib.pyplot as plt import numpy as np import altair as alt from vega_datasets import data from altair import datum import altair_recipes as ar from altair_recipes.common import viz_reg_test from altair_recipes.display_pweave import show_test
@viz_reg_test def test_boxplot_color(): source = data.barley() return ar.boxplot( source, columns=["yield"], group_by="year", color=True, width=800 // len(source["site"].unique()), ).facet(column="site")
show_test(test_boxplot_color)
 piccolbo
commented
4 years ago
piccolbo
commented
4 years ago I am thinking about waiting for hydrogen to support vega lite 4 before releasing this. Should take < 1 month. Monitoring https://github.com/nteract/hydrogen/issues/1847
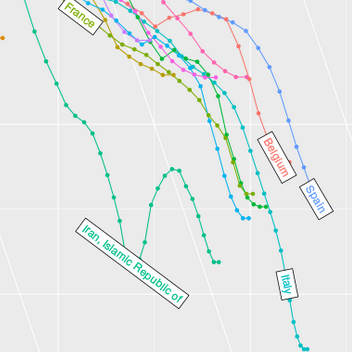
Description
I was looking to generate boxplots with dashes on the top of the the whisker lines and found this tool (thanks!). I generated a boxplot with my own data and noticed that it was only adding a different color to the whisker line but not the box. I subsequently stepped back and attempted to run an example from your website and the same thing happened (image).
What I Did