Thanks for the suggestion(s), though it's quite hard to track an issue with so many requests together. It is typically better to split them up so they can get different priority, etc. Anyway, here's some feedback that might help others, if they decide to look at doing any of this:
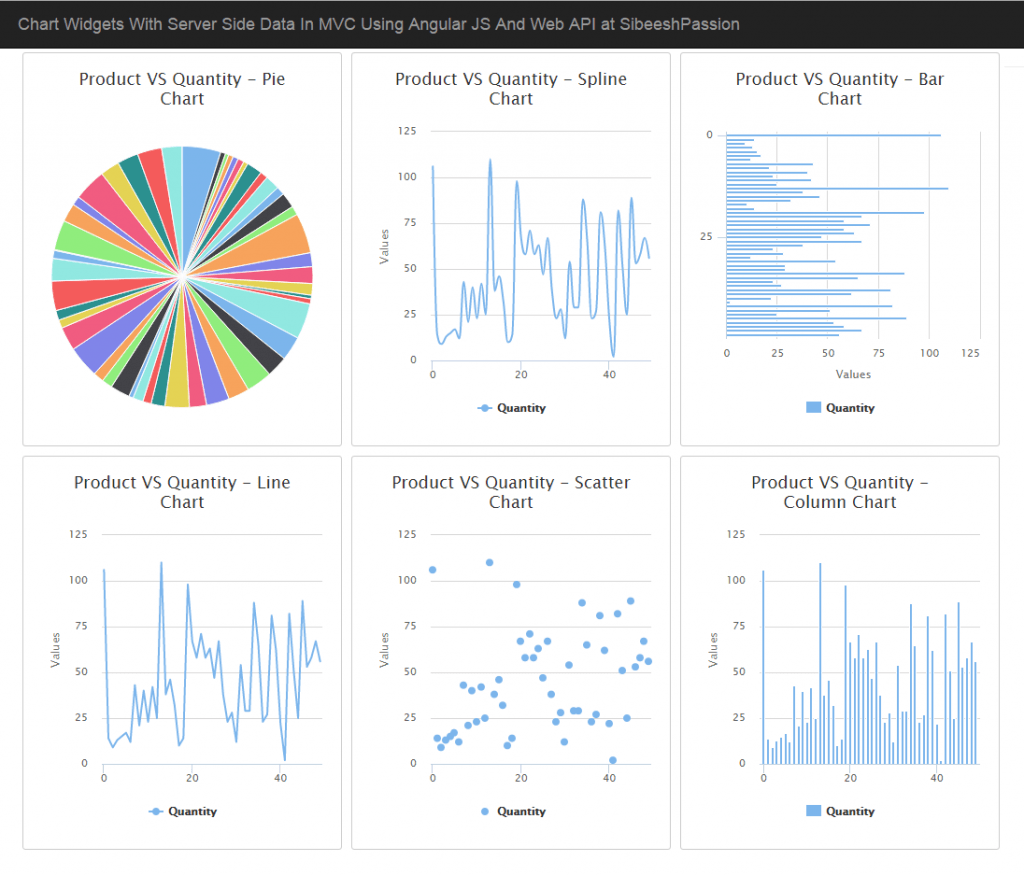
For charts/graphs, I suggest looking at OxyPlot which @LorenVS made Mac/WPF wrappers for here, or you can fix up the OxyPlot.Eto port here to support all of the platforms Eto supports.
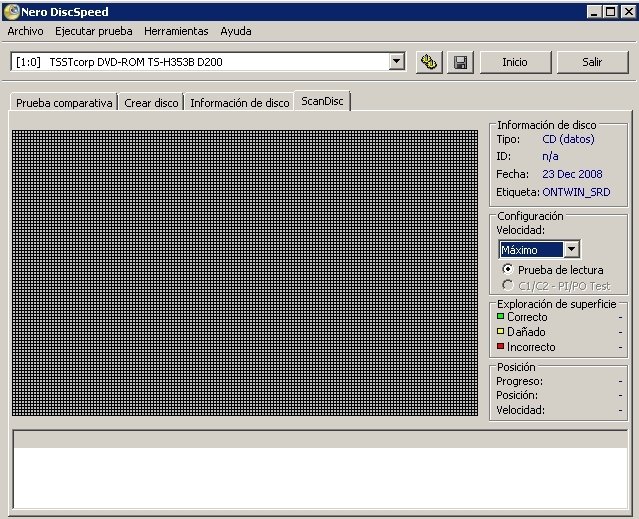
As for the the pixel map, it'd be pretty dead simple to make your own based on the Drawable control.
I'm not sure what's available for Gauges, but it could be a lot of work if starting from scratch.
Cheers! Curtis.
May I suggest, a few controls/widgets that I've seen used a in a lot of places, yet it seems everyone has to custom code them.
A pixel map (not an image) that draws a Color[] as a series of squares and can optionally put a border separating them. Example:
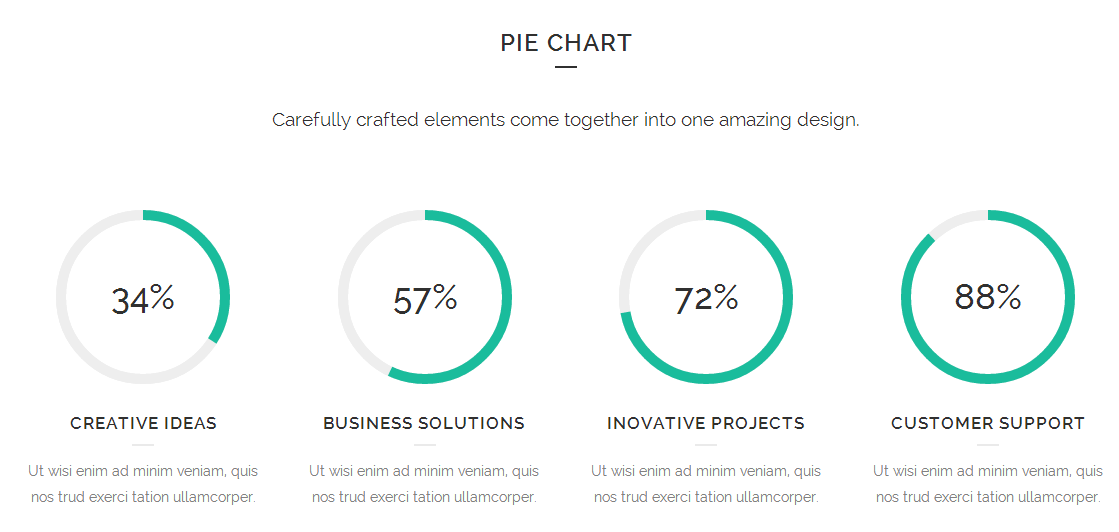
Pie charts, filled to the center
and not
Circular progress "bars"
And why not other kind of plottings
Gauges
System tray / OSX Menubar icon.