 leandrofomtana
commented
2 years ago
leandrofomtana
commented
2 years ago Would it be possible to add javascript to the inside of the cell? So it can be used as buttons that interact with the data
Closed AnnMarieW closed 3 years ago
leandrofomtana
commented
2 years ago Would it be possible to add javascript to the inside of the cell? So it can be used as buttons that interact with the data
closes #915 closes #800
This pull request allows for the use html tags in markdown text.
As discussed here in in #915 DataTable uses Remarkable for its markdown and the default is set to disable html input, probably to reduce XSS vulnerabilities. This PR adds the
htmloption tomarkdown_optionsprop to make it possible to "opt in" and allow html in markdown.I found this reported security issue with Remarkable which was fixed in 2019 in version 1.7.2. DashTable currently uses version ^2.0.1. I'm not sure I understand the XSS risks -- I think this would be a good topic to include in the docs. Would there be less risk if the markdown columns are not editable when html is allowed?
Also for the docs, here is some good info about using html with markdown, and below are 3 examples to show some of the new features:
Examples
Font Awesome Icons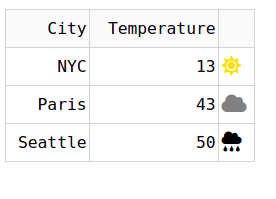
<i>Change Color of Icons with Conditional Formatting Formatting text with html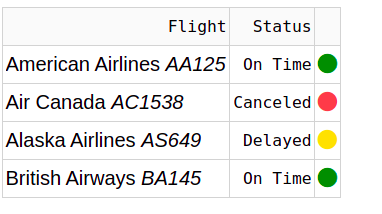
Adding images using the html![]() tag. This can make it easier to control image size and add other style.
tag. This can make it easier to control image size and add other style.