 jackparmer
commented
6 years ago
jackparmer
commented
6 years ago cc @Kully - this is going to be an issue with the Python county choropleth as well. Probably watch this issue and hold off on the WebGL approach until this is fixed:

Closed cpsievert closed 3 years ago
jackparmer
commented
6 years ago cc @Kully - this is going to be an issue with the Python county choropleth as well. Probably watch this issue and hold off on the WebGL approach until this is fixed:
 Kully
commented
6 years ago
Kully
commented
6 years ago I actually found that toself fill didn't work with just one polygon (ie list of coordinates defining a contained polygon)
But I only checked in the Python API
jackparmer
commented
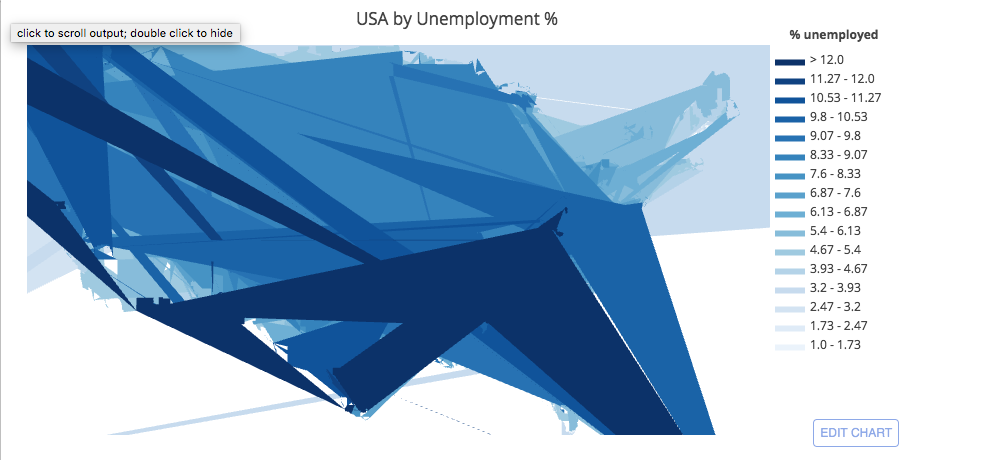
6 years ago Here is what I get for a full US county map for SVG vs WebGL using toself:

 alexcjohnson
commented
6 years ago
alexcjohnson
commented
6 years ago related: #2450
Kully
commented
6 years ago Another example of the USA choropleth from here: https://plot.ly/python/county-choropleth/#the-entire-usa This is switching scatter -> scattergl in the figurefactory.
jackparmer
commented
6 years ago ⬆️ Doesn't look like the recent scattergl fill changes fixed things for this particular use case
 etpinard
commented
6 years ago
etpinard
commented
6 years ago Doesn't look like the recent scattergl fill changes fixed things for this particular use case
There haven't been any scattergl fill changes since the regl push back January.
jackparmer
commented
6 years ago Oh, I thought @dy had done some work on regl-line2d fills after January. I guess I'm misremembering.
etpinard
commented
6 years ago He's done some work. But none of which is ready to get merged at this stage.
 dy
commented
6 years ago
dy
commented
6 years ago It is coming, after regl-text. Pls stay tuned)
alexcjohnson
commented
6 years ago A nice pared-down reproduction from @llnns in #2845:
Using scattergl with toself fill option results in a "ghost"/wrong/extra fill among the first points of each object. A minimal example creating three rectangles:
https://codepen.io/anon/pen/NBvbbv
Results in:
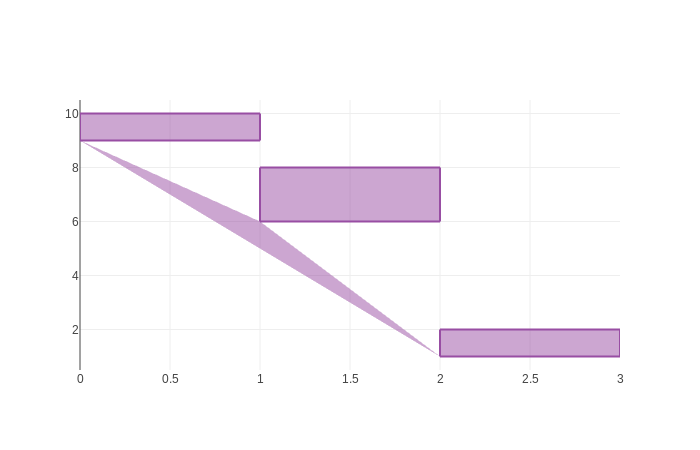
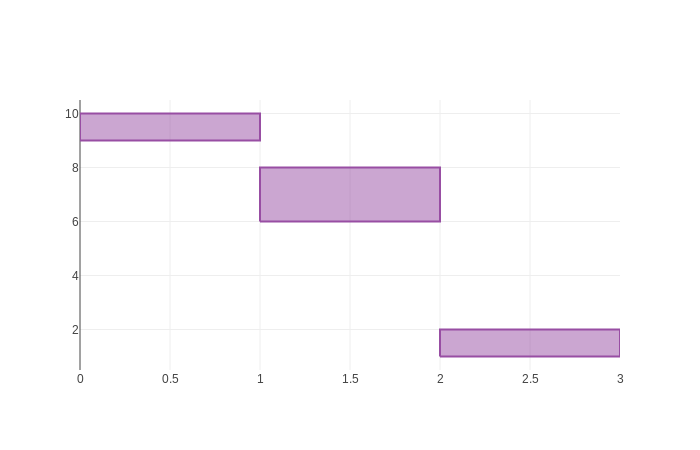
Also, using the same data with scatter type has the expected output:
 llnns
commented
6 years ago
llnns
commented
6 years ago Hey, maybe another hint here: Using https://codepen.io/anon/pen/NBvbbv as an example.
It seems that the extra triangle comes from the triangulation function earcut. The block at https://github.com/plotly/plotly.js/blob/1ecef456e418667e1b0378b7c45c8bb9eff94dcd/src/traces/scattergl/index.js#L452-L466 is generating the follow pos array:
pos = [
  0,
  9,
  0,
  10,
  1,
  10,
  1,
  9,
  0,
  9,
  0,
  9,
  1,
  6,
  1,
  8,
  2,
  8,
  2,
  6,
  1,
  6,
  1,
  6,
  2,
  1,
  2,
  2,
  3,
  2,
  3,
  1,
  2,
  1,
  2,
  1
]
That it is been pass to earcut function as earcut(pos, []) (I think at: https://github.com/a-vis/regl-line2d/blob/d4e34d3d38b20fce5bc0398e3cf30181d1f506a0/index.js#L519 ) resulting in the follow triangles indices array:
triangles = [
  15,
  14,
  13,
  9,
  8,
  7,
  3,
  2,
  1,
  4,
  3,
  1,
  15,
  13,
  12,
  6,
  0,
  12,
  7,
  10,
  9
]
Notice that the result has 21 indices, 7 triangles, one more than the 6 needed for the 3 rectangles example. Also, I am not sure if it is intended, but in the pos array the last position of each rectangle is duplicated.
etpinard
commented
6 years ago A very nice example from @ErwanMAS in #3025
Please look .
https://codepen.io/erwanmas/pen/dqQrbR
The issue is generated by https://github.com/mapbox/earcut in https://github.com/a-vis/regl-line2d . AND earcut doesn't guarantee correctness
https://github.com/mapbox/earcut/blob/master/README.md
a simple console.log here https://github.com/a-vis/regl-line2d/blob/b9d56d51e1598c4ee7a9a5e0a733e920daf63c2d/index.js#L520 will output only 1 triangle , instead of 2 triangles
 ruijin
commented
4 years ago
ruijin
commented
4 years ago I was trying to use plotly's scattergl to rendering thousands of boxes and hit this old issue. It seems like nobody is working on it so I would like to give it a try.
I think this is the cause of the issue:
1) for scatter trace, we use null in x or y to "break" the plotline, as @llnns showed in his/her nice example.
3) when plotly sees the nulls it close the polyline and drop the null. https://github.com/plotly/plotly.js/blob/1ecef456e418667e1b0378b7c45c8bb9eff94dcd/src/traces/scattergl/index.js#L452-L466
2) regl.Line2D get the polyline and use earcut algorithm to triangulate the whole ply line as single polygon.
As a result of above, we end up with a strange shape polygon, use @llnns's example again:

I don't think this is a bug in https://github.com/mapbox/earcut , since it does what regl ask it to do: triangulate a single polygon.
The solution I am proposing is: 1) plotly keep the nulls when sending ployline to regl.Line2D 2) regl recognizes the nulls, and break the ployline into separate polygons and triangulate each of them separately.
I have a prototype working locally, at least for my usecase (fill=toself). But this fix requires a pull request to both plotly and regl.Line2D, and I am not expert in either javascript nor github, so I would really appreciate some guidance here.
 rlele5
commented
4 years ago
rlele5
commented
4 years ago Hi all, still having this issue. Are there any plans to merge any of the proposed solutions into main plotly? This single bug fix could potentially fix so many of my plotting performance issues, so I'm eagerly looking forward to it! Hopefully it can be prioritized.
Another example posted here if needed: https://community.plotly.com/t/feature-request-for-gantt-gl-like-scatter-gl/37925/4
Tag: @archmoj, @etpinard
jackparmer
commented
4 years ago This issue has been tagged with NEEDS SPON$OR
A community PR for this feature would certainly be welcome, but our experience is deeper features like this are difficult to complete without the Plotly maintainers leading the effort.
Sponsorship range: $15k-$20k
What Sponsorship includes:
Please include the link to this issue when contacting us to discuss.
rlele5
commented
4 years ago Thanks for the update :). Now another feature request for @github, if you're listening - we should have Gofundmes attached to issues! I'd gladly commit a few hundred to this issue if it could be done in a safe and organized way
 avsdev-cw
commented
3 years ago
avsdev-cw
commented
3 years ago I would also like to see this fixed, so +1 for that.
However that I feel that sponsership range is pretty excessive considering a bunch of people have already dug out what the root cause appears to be...
ruijin
commented
3 years ago Created two PR to plotlyjs and regl
https://github.com/plotly/plotly.js/pull/5355 https://github.com/gl-vis/regl-line2d/pull/49
I am happy to help with any further testing, as long as this got fixed.
rlele5
commented
3 years ago @ruijin , thanks for making the pull requests! I'm excited to try them out!
rlele5
commented
3 years ago Hi @ruijin , I tried manually updating the /Library/Frameworks/Python.framework/Versions/3.7/share/jupyter/lab/staging/node_modules/plotly.js/src/traces/scattergl and /Library/Frameworks/Python.framework/Versions/3.7/share/jupyter/lab/staging/node_modules/regl-line2d/index.js code and then I restarted my jupyter notebook to see if it worked. However, I still saw the same issue. I'm pretty sure the issue is on my end, but do you know how I can get my plotly.py library to "uptake" the changes that I manually made to plotly.js? I've tried deleting plotly.py's __pycache__ and restarting/rerunning to no avail.
 archmoj
commented
3 years ago
archmoj
commented
3 years ago Fixed via #5355.
https://codepen.io/cpsievert/pen/ZvNqjQ
Note that fillcolor renders correctly when
type: scatter.