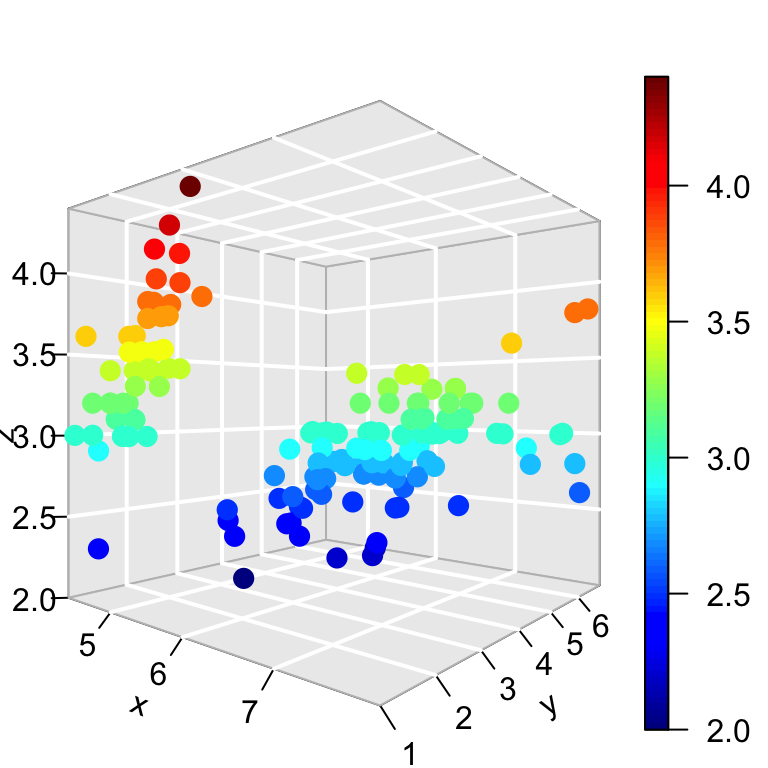
Rather than "disable moving the background", I think the feature should be additive: enable either axis lines or (unfilled) grids from (0,0,0) - or even from a configurable point in 3D space. So for example, in addition to the "axis lines from the origin" in that post:
 you could also have grids through the origin, but without a solid fill (this is only one plane, and not at x=0, but gives the essential idea:

Also, while we're on the topic: the current behavior of only allowing one "background" plane for each dimension is a bit funny when one or more axes is very close to in the plane of the screen. Feels to me as though it would be better to show any planes that we're looking at the inside of, even if we only put axis labels on one of them. Like this:

See https://community.plot.ly/t/do-not-dynamically-move-zero-line-in-3d-scatter-plot/30863 At the moment, when the scene is rotated the axis lines can move to edges of the cubes which are always "at the back". Having a parameter to disable this behaviour (axes lines always going to (0, 0, 0) no matter the view) would be nice.