 sigmavirus24
commented
6 years ago
sigmavirus24
commented
6 years ago Please provide us with the output of
python -m requests.helpIf that is unavailable on your version of Requests please provide some basic information about your system (Python version, operating system, etc).
 Munroc
 nateprewitt
 initbar
 leoszn
 Badiboy
 jotunskij
 pawel-lmcb
 BarryThrill
 popjxc
 tallona
 PedanticHacker
 MuhammadAliShahzad
 far-rainbow
 ghost
ghost guyskk
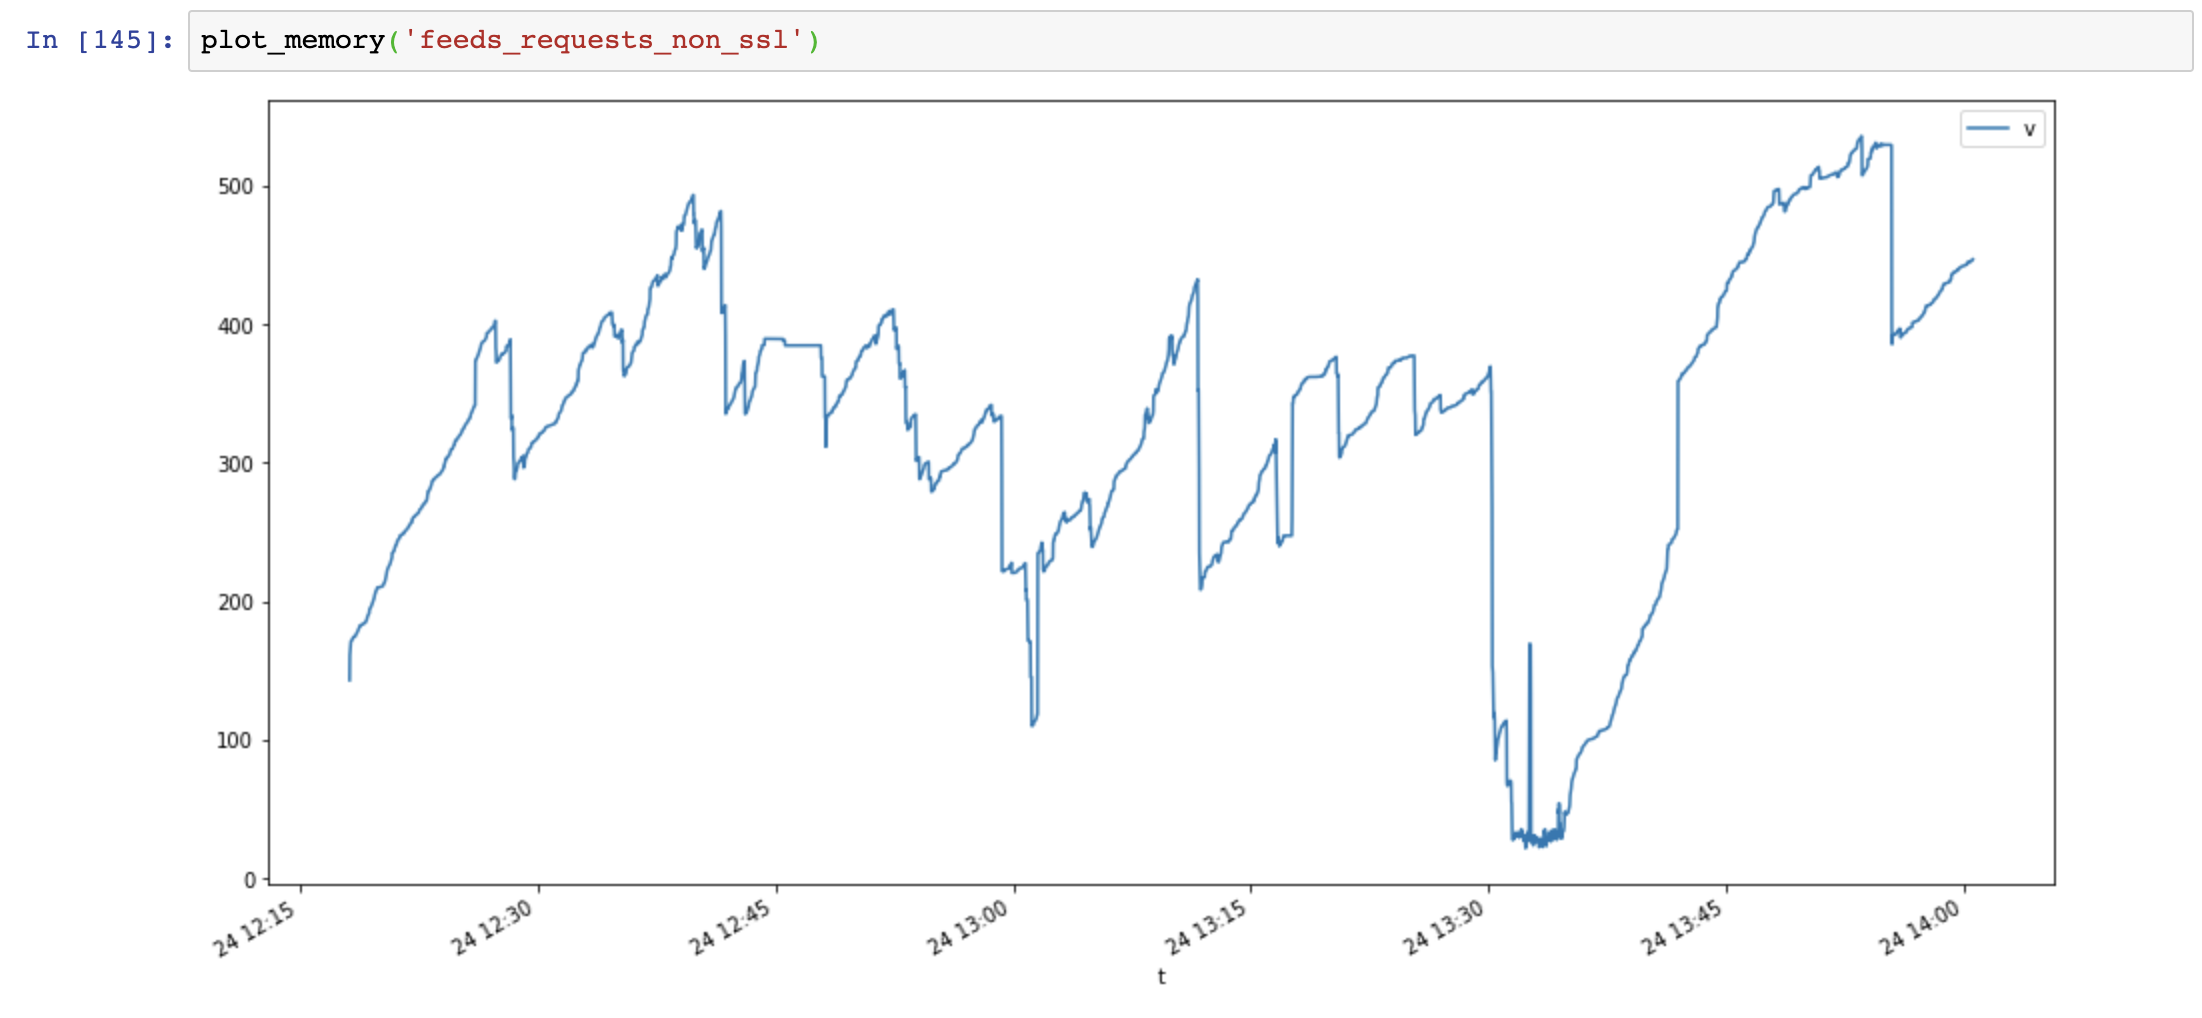


 VeNoMouS
 andre487
 constantind
 teodoryantcheff
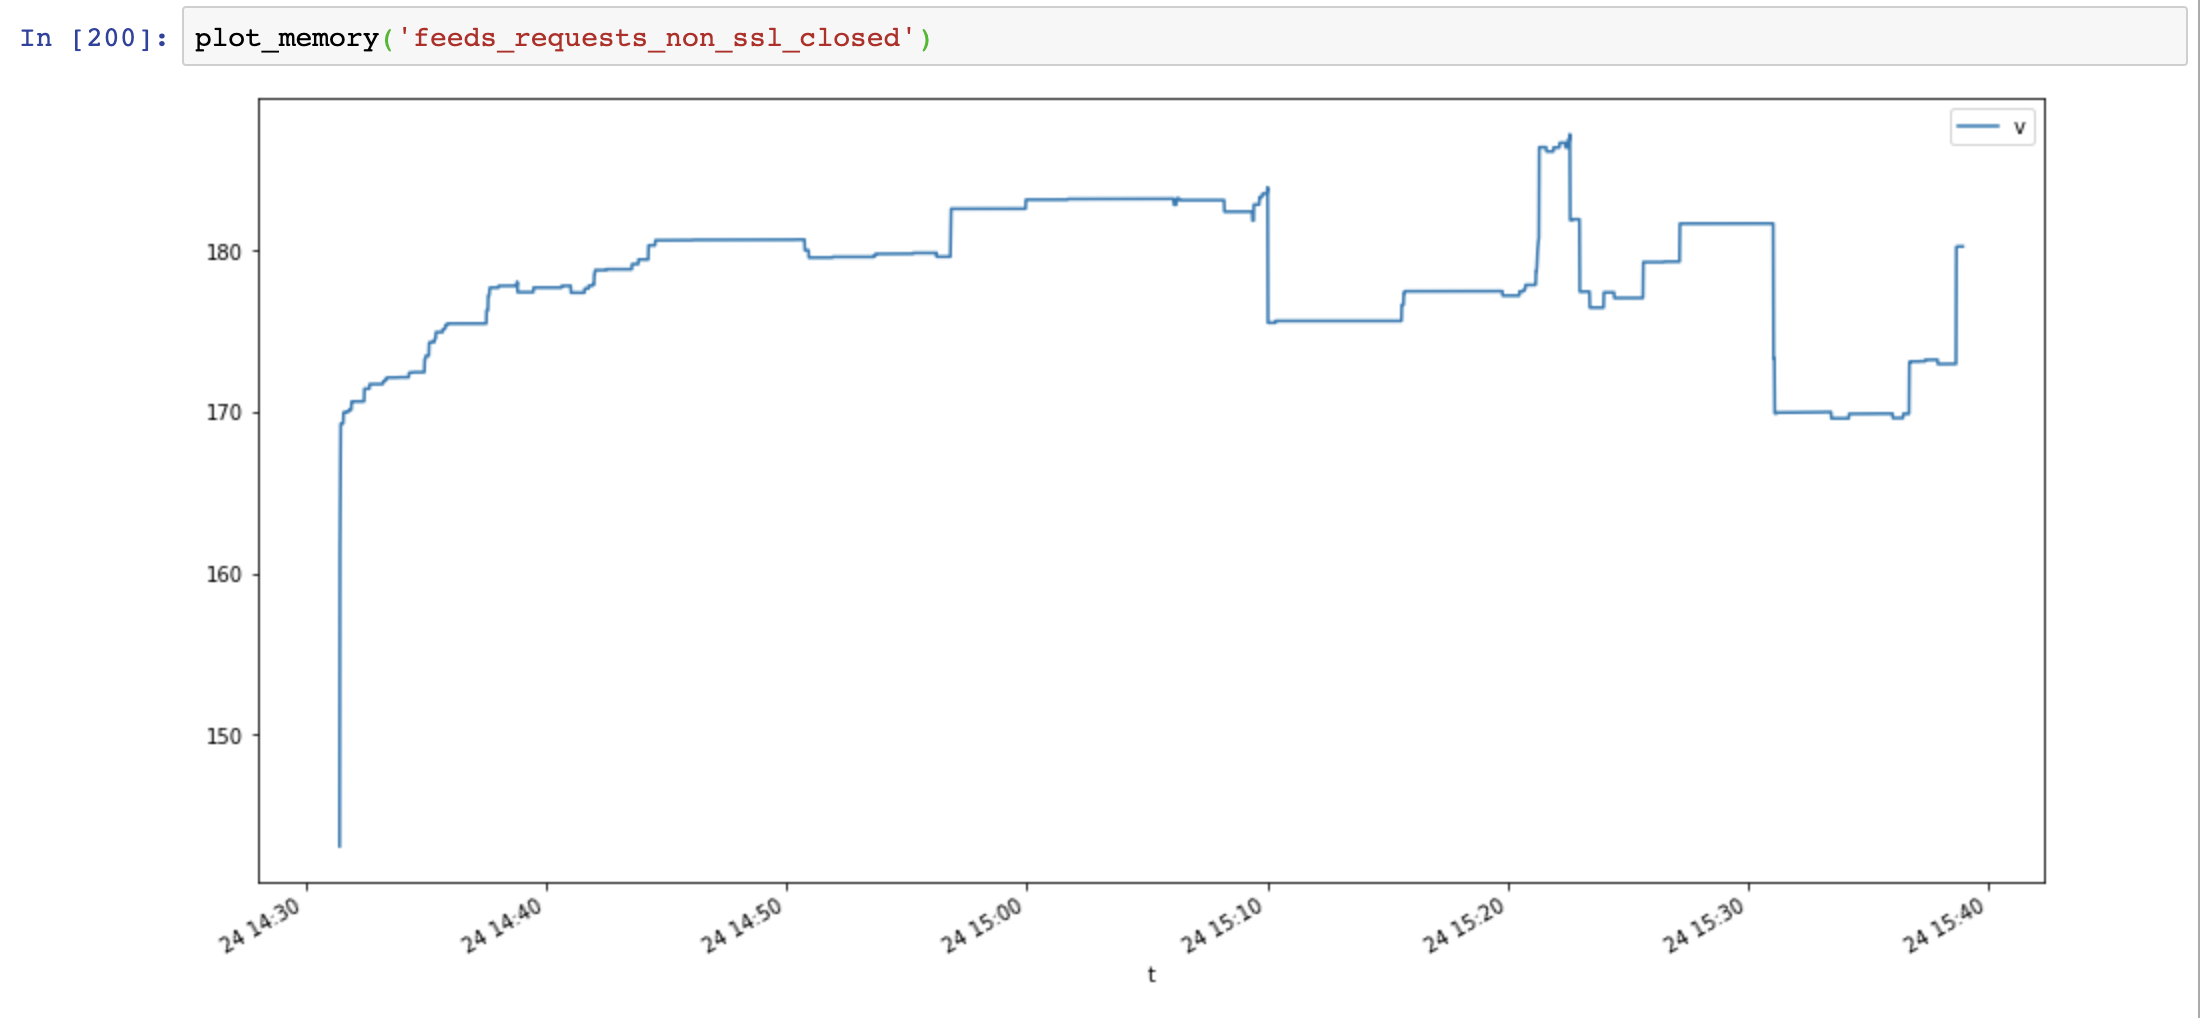
Summary.
Expected Result
Program running normally
Actual Result
Program consuming all ram till stops working
Reproduction Steps
Pseudocode:
System Information