pytroll / pyorbital

Orbital and astronomy computations in python
http://pyorbital.readthedocs.org/
GNU General Public License v3.0
224 stars 77 forks source link

How compute satellite look angle? #105

Open ahvahsky2008 opened 2 years ago

ahvahsky2008 commented 2 years ago

Hi. I have in input only tle. How calcullate observation area? image image

mraspaud commented 
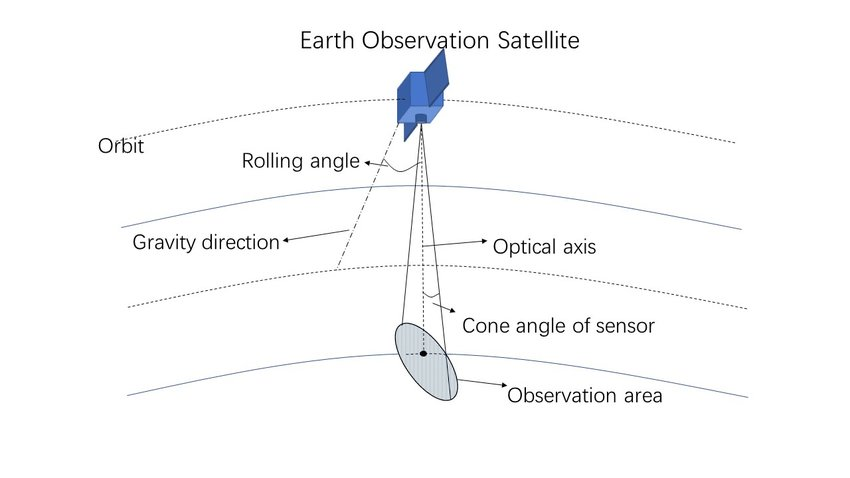
2 years ago

Hi, TLE is a good start, but you need more information than this to compute the observation area, in particular the characteristics of the sensor like the resolution and min/max scanning angle along and across track.

Once you have this, you can try to define a scanning geometry like here: https://github.com/pytroll/pyorbital/blob/main/pyorbital/geoloc_instrument_definitions.py and then use something like this to get the positions of your sensor's pixels on the ground: https://github.com/pytroll/pyorbital/blob/main/pyorbital/geoloc_example.py

Good luck!

ahvahsky2008 commented 2 years ago

@mraspaud thx! I try run geoloc_example.py but its raise error ValueError: operands could not be broadcast together with shapes (3,17901) (1,2)

mraspaud commented 2 years ago

Yes, the script might not be up to date, but if you have the sensor definition set properly, I'm sure you can adapt the example to your use case :)

ahvahsky2008 commented 2 years ago

but if you have the sensor definition set properly,

could you pls give some hint? which param https://i.ibb.co/0hJFHct/xixa.png

mraspaud commented 2 years ago

I have no idea what sensor you are working with, so it's going to be difficult for me to give you a hint :sweat_smile:

If you paste your sensor definition in the same format as in https://github.com/pytroll/pyorbital/blob/main/pyorbital/geoloc_instrument_definitions.py and a suitable TLE, I'll try to find some time to take a look at this.

ahvahsky2008 commented 2 years ago

Thx for reply) Ok. I try work with sat SUOMI NPP All works (may be), but way of satellite incorrect image image

from geoloc_instrument_definitions import avhrr
import numpy as np
from datetime import datetime
from pyorbital.geoloc import ScanGeometry, compute_pixels, get_lonlatalt
from mpl_toolkits.basemap import Basemap
import matplotlib.pyplot as plt

from pyorbital.orbital import Orbital

tle1 = "1 37849U 11061A   22207.46972667  .00000025  00000-0  32513-4 0  9995"
tle2 = "2 37849  98.7330 145.4829 0001172  89.7809  20.2392 14.19535383556723"

t = datetime(2022, 7, 26, 19, 4, 1, 575000)

scanline_nb = 10

scan_points = np.arange(24, 2048, 40)

sgeom = avhrr(scanline_nb,scan_points)

rpy = (0, 0, 0)

s_times = sgeom.times(t)
pixels_pos = compute_pixels((tle1, tle2), sgeom, s_times, rpy)
pos_time = get_lonlatalt(pixels_pos, s_times)

m = Basemap(projection='eck4', llcrnrlat=24, urcrnrlat=70, llcrnrlon=-25, urcrnrlon=120,
            lat_ts=58, lat_0=58, lon_0=14, resolution='l')

x, y = m(pos_time[0], pos_time[1])
p1 = m.plot(x, y, marker='+', color='red', markerfacecolor='red', markeredgecolor='red', markersize=1, markevery=1,
            zorder=4, linewidth=0.0)
m.fillcontinents(color='0.85', lake_color=None, zorder=3)
m.drawparallels(np.arange(-90., 90., 5.), labels=[1, 0, 1, 0], fontsize=10, dashes=[1, 0],
                color=[0.8, 0.8, 0.8], zorder=1)
m.drawmeridians(np.arange(-180., 180., 5.), labels=[0, 1, 0, 1], fontsize=10, dashes=[1, 0],
                color=[0.8, 0.8, 0.8], zorder=2)

plt.show(block=True)
mraspaud commented 2 years ago

I'm not sure I understand. The plot shows north America, but the Basemap definition seems to be over Europe?

ahvahsky2008 commented 2 years ago

counter question - plot shows position of satellite on proper datetime?

mraspaud commented 2 years ago

yes. Don't forget the time should be given in utc. Figure_1

Here is the script I used to generate this image:

from pyorbital.geoloc_instrument_definitions import avhrr
import numpy as np
from datetime import datetime
from pyorbital.geoloc import ScanGeometry, compute_pixels, get_lonlatalt
import matplotlib.pyplot as plt

import cartopy.crs as ccrs
import cartopy.feature as cfeature
from pyorbital.orbital import Orbital

def main():

    # Noaa 19, july 27 2022
    tle1 = "1 33591U 09005A   22208.15634740  .00000133  00000+0  97035-4 0  9993"
    tle2 = "2 33591  99.1455 243.1224 0014915  77.9753 282.3088 14.12592326694052"

    t = datetime(2022, 7, 27, 14, 10, 0)

    scanline_nb = 10

    scan_points = np.arange(24, 2048, 40)

    sgeom = avhrr(scanline_nb,scan_points)

    rpy = (0, 0, 0)

    s_times = sgeom.times(t)
    pixels_pos = compute_pixels((tle1, tle2), sgeom, s_times, rpy)
    pos_time = get_lonlatalt(pixels_pos, s_times)

    fig = plt.figure()
    proj4_params = dict(proj='eck4',
                        lat_ts=58, lat_0=58)
    crs = ccrs.PlateCarree(14)
    ax = fig.add_subplot(1, 1, 1, projection=crs)
    ax.set_extent([-25, 120, 24, 90], crs=crs)

    ax.add_feature(cfeature.LAND)
    ax.add_feature(cfeature.OCEAN)
    ax.add_feature(cfeature.COASTLINE)

    x, y = (pos_time[0], pos_time[1])
    p1 = plt.plot(x, y, marker='+', color='red', markerfacecolor='red', markeredgecolor='red', markersize=1, markevery=1,
                zorder=4, linewidth=0.0)

    plt.show()

if __name__ == '__main__':
    main()
mraspaud commented 2 years ago

And what another website reports: image

ahvahsky2008 commented 2 years ago

Ok, we have satellite trajectory on purpose datetime. Main question - how calc observation area? image

mraspaud commented 2 years ago

The script you have provides observation points, right? So from there you can get pixels for given times of interest.

ahvahsky2008 commented 2 years ago

I guess this lines are swath ? image

mraspaud commented 2 years ago

yes, approximately. You may want to compute some more times in between, a swath is usually more rounded (I'm assuming the satellite goes horizontally in this image)

ahvahsky2008 commented 2 years ago

I added some more scan lines and its look like spline) image

But in summary, Width of swath != satellite capture band. Its may be smaller etc... How calc this radius?

mraspaud commented 2 years ago

A you can see in the previous script, the points compute across track are scan_points = np.arange(24, 2048, 40) if you want just the edges, set scan_points = np.array([0, 2047])...

ahvahsky2008 commented 2 years ago

Hi again) could you pls explain how compute scangeometry for kanopus v1 ?. It's has 2 sensors image

mraspaud commented 2 years ago

This is unfortunately not enough information to do that. You need to know the scan pattern (sweep, push broom, circular, etc), the scanning angles for each pixel (or at least at the edges if this is what you are interested in), the resolution, etc...

ahvahsky2008 commented 2 years ago

sorry, incorrectly expressed. How calc IFOV ? (for kanopus v1) image

mraspaud commented 2 years ago

yes, that's the question! you need to find a technical description of the instrument that gives you the angle values for the IFOV and FOV

Zia- commented 3 months ago

@mraspaud Thanks a lot for helping this issue.

I'm on a similar pursuit. However, as can be seen, a lot of instrument definitions are missing here https://github.com/pytroll/pyorbital/blob/main/pyorbital/geoloc_instrument_definitions.py.

If I'm only interested in calculating the area on the earth that has been scanned (in whatever mode, sweep, push broom etc.) by a sensor in last 24 hours, shouldn't knowing its trajectory, altitude (which I assume remains constant), min and max look angle (both of which I assume remain constant) and respective ground resolution and a bit of trigonometry enough to calculate it?

Or am I over simplifying it?

It would be amazing, however, if more instruments definition can be added to geoloc_intrument_definitions.

mraspaud commented 3 months ago

Indeed, that is totally possible the way you describe it. But that's not the way pyorbital computes it unfortunately. We would very much like to have more instrument definitions in the package, but in multiple place I've seen that we "cheat" by using eg AVHRR, altering the viewing angle and using that to compute the footprint...