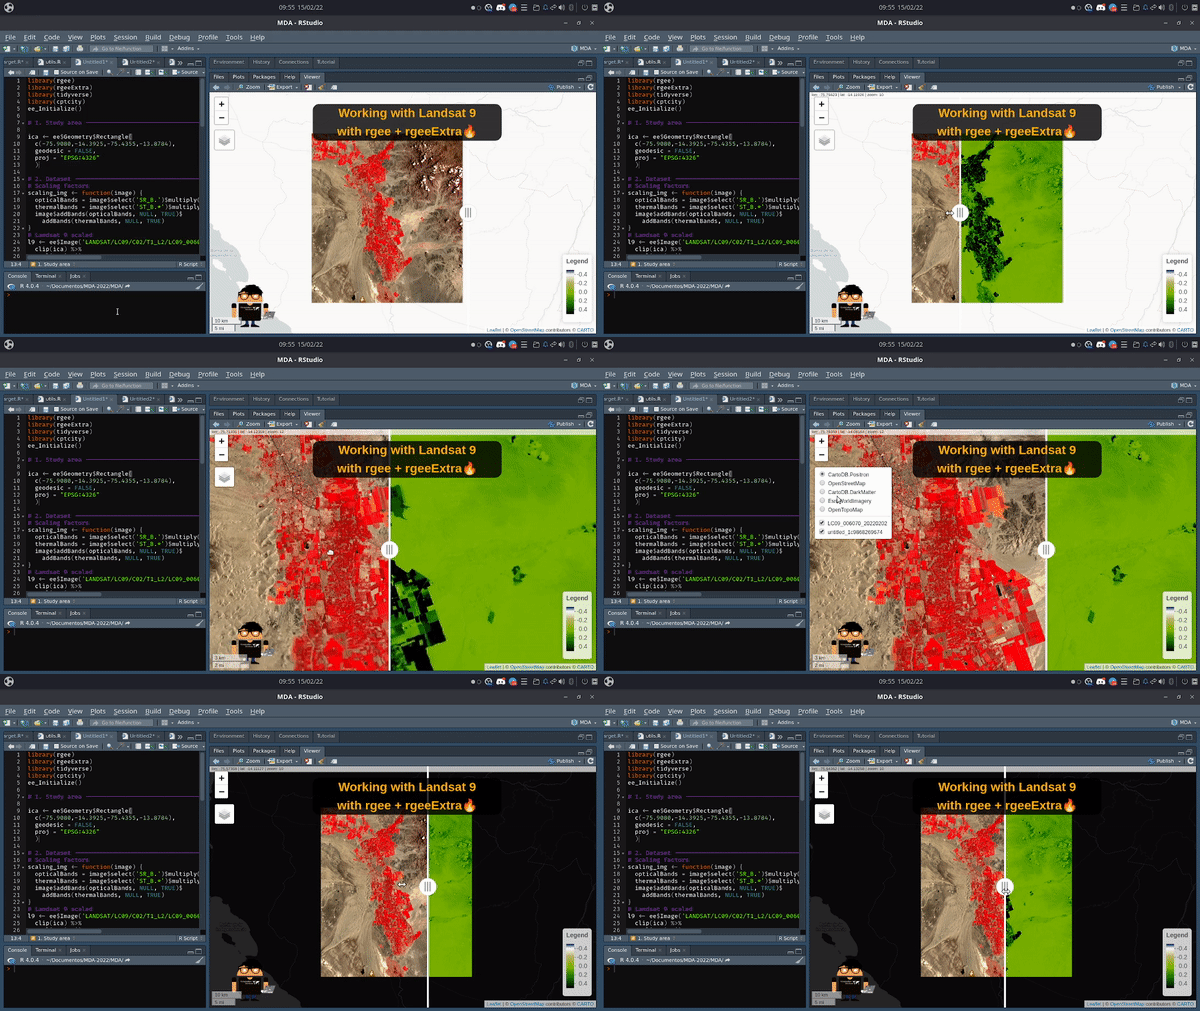
Hi @kongdd , the equivalent the ui.SplitPanel in rgee is the use the following symbol | , here an example 👇

Closed kongdd closed 2 years ago
Hi @kongdd , the equivalent the ui.SplitPanel in rgee is the use the following symbol | , here an example 👇

For the ui.Map.Linker in R depende of the two packages leaflet.minicharts + manipulateWidget or leafsync, here an example. 👇
library(tidyverse)
library(rgee)
library(leaflet.minicharts)
library(manipulateWidget)
ee_Initialize(user = "antony.barja@upch.pe")

m1 <- Map$addLayer(eeObject = ee$Image("CGIAR/SRTM90_V4")) %>%
  syncWith("one")

m2 <- Map$addLayer(
  eeObject = ee$Image("CGIAR/SRTM90_V4"),
  visParams = list(min=0,max=3000)
  ) %>%
  syncWith("one")

combineWidgets(m1, m2)awesome! Thank you very much
I am trying to use the ui.Map.Linker function in my shiny app. However, they are not work in renderLeaflet.
Do you have any solution?
  ---
  title: "hello"
  author: "Dongdong"
  date: "`r Sys.Date()`"
  output: html_document
  runtime: shiny
  ---

  ```{r setup, include=FALSE}
  knitr::opts_chunk$set(echo = TRUE)

  library(rgee)
  library(shiny)
  library(leaflet)

  ee_Initialize()
library(leaflet.minicharts)
library(manipulateWidget)
renderLeaflet({
m1 <- Map$addLayer(eeObject = ee$Image("CGIAR/SRTM90_V4")) %>%
syncWith("one")
m2 <- Map$addLayer(
eeObject = ee$Image("CGIAR/SRTM90_V4"),
visParams = list(min=0,max=3000)
) %>% syncWith("one")
m = combineWidgets(m1, m2)
m
}) library(leafsync)
renderLeaflet({
m1 <- Map$addLayer(eeObject = ee$Image("CGIAR/SRTM90_V4"))
m2 <- Map$addLayer(
eeObject = ee$Image("CGIAR/SRTM90_V4"),
visParams = list(min=0,max=3000)
)
m = sync(m1, m2)
m
})
As the title, any idea how to implement the function of
ui.Map.Linkerandui.SplitPanelinrgee?https://geemap.org/notebooks/04_split_panel_map/ https://geemap.org/notebooks/70_linked_maps/