r-spatial / stars

Spatiotemporal Arrays, Raster and Vector Data Cubes
https://r-spatial.github.io/stars/
Apache License 2.0
561 stars 94 forks source link

Reading NetCDF with curvilinear grid - empty coordinate values #351

Closed michaeldorman closed 3 years ago

michaeldorman commented 3 years ago

I am trying to read a NetCDF file with satellite measurements of CH4. The following does work, and I get a raster with lon/lat/value:

library(stars)

# Get data
url = "https://www.dropbox.com/s/1ekgne0mklt0trh/S5P_OFFL_L2__CH4____20200821T100143_20200821T114312_14798_01_010302_20200823T193105.nc?dl=1"
filename = tempfile(fileext = ".nc")
download.file(url, filename)

# Read
sd = gdal_subdatasets(filename)
label = sapply(sd, function(x) gsub(".*/", "", x))
sd_values = sd[label == "methane_mixing_ratio"][[1]]
sd_lon = sd[label == "longitude"][[1]]
sd_lat = sd[label == "latitude"][[1]]
r = read_stars(sd_values, curvilinear = c(sd_lon, sd_lat))
r
## stars object with 3 dimensions and 1 attribute
## attribute(s):
##  methane_mixing_ratio 
##  Min.   :1512         
##  1st Qu.:1866         
##  Median :1922         
##  Mean   :1904         
##  3rd Qu.:1942         
##  Max.   :2029         
##  NA's   :836889       
## dimension(s):
##      from   to         offset delta  refsys point               values x/y
## x       1  215             NA    NA  WGS 84    NA [215x4173] NA,...,NA [x]
## y       1 4173             NA    NA  WGS 84    NA [215x4173] NA,...,NA [y]
## time    1    1 2020-08-21 UTC    NA POSIXct    NA                 NULL    
## curvilinear grid

Hovever, the lon/lat matrices turn out to be filled with NA:

attr(r, "dimensions")[["x"]][["values"]][1:5, 1:5]
##      [,1] [,2] [,3] [,4] [,5]
## [1,]   NA   NA   NA   NA   NA
## [2,]   NA   NA   NA   NA   NA
## [3,]   NA   NA   NA   NA   NA
## [4,]   NA   NA   NA   NA   NA
## [5,]   NA   NA   NA   NA   NA
attr(r, "dimensions")[["y"]][["values"]][1:5, 1:5]
##      [,1] [,2] [,3] [,4] [,5]
## [1,]   NA   NA   NA   NA   NA
## [2,]   NA   NA   NA   NA   NA
## [3,]   NA   NA   NA   NA   NA
## [4,]   NA   NA   NA   NA   NA
## [5,]   NA   NA   NA   NA   NA

A workaround that does seem to work fine is reading the lon/lat subdatasets manually, then putting them into the dimensions attribute:

lon = read_stars(sd_lon)
lat = read_stars(sd_lat)
attr(r, "dimensions")[["x"]][["values"]] = lon[[1]][,,1]
attr(r, "dimensions")[["y"]][["values"]] = lat[[1]][,,1]

Here is the result:

plot(r, axes = TRUE)

Screenshot from 2020-11-18 14-42-02

I’m wondering if there is another solution to read the file without a workaround, or perhaps the problem is in the dataset itself.

Thanks for any suggestion!

Session information:

sessionInfo()
## R version 4.0.3 (2020-10-10)
## Platform: x86_64-pc-linux-gnu (64-bit)
## Running under: Ubuntu 20.04.1 LTS
## 
## Matrix products: default
## BLAS:   /usr/lib/x86_64-linux-gnu/blas/libblas.so.3.9.0
## LAPACK: /usr/lib/x86_64-linux-gnu/lapack/liblapack.so.3.9.0
## 
## locale:
##  [1] LC_CTYPE=en_US.UTF-8       LC_NUMERIC=C               LC_TIME=en_US.UTF-8       
##  [4] LC_COLLATE=en_US.UTF-8     LC_MONETARY=en_US.UTF-8    LC_MESSAGES=en_US.UTF-8   
##  [7] LC_PAPER=en_US.UTF-8       LC_NAME=C                  LC_ADDRESS=C              
## [10] LC_TELEPHONE=C             LC_MEASUREMENT=en_US.UTF-8 LC_IDENTIFICATION=C       
## 
## attached base packages:
## [1] stats     graphics  grDevices utils     datasets  methods   base     
## 
## other attached packages:
## [1] stars_0.4-4  sf_0.9-7     abind_1.4-5  ncdf4_1.17   raster_3.4-5 sp_1.4-4    
## 
## loaded via a namespace (and not attached):
##  [1] Rcpp_1.0.5         pillar_1.4.6       compiler_4.0.3     class_7.3-17      
##  [5] tools_4.0.3        digest_0.6.25      evaluate_0.14      lifecycle_0.2.0   
##  [9] tibble_3.0.4       lattice_0.20-41    RNetCDF_2.4-2      pkgconfig_2.0.3   
## [13] rlang_0.4.8        DBI_1.1.0          cli_2.1.0          yaml_2.2.1        
## [17] parallel_4.0.3     xfun_0.18          e1071_1.7-4        ncmeta_0.3.0      
## [21] stringr_1.4.0      knitr_1.29         dplyr_1.0.2        generics_0.0.2    
## [25] vctrs_0.3.4        classInt_0.4-3     grid_4.0.3         tidyselect_1.1.0  
## [29] glue_1.4.2         R6_2.4.1           fansi_0.4.1        rmarkdown_2.5     
## [33] purrr_0.3.4        magrittr_1.5       htmltools_0.5.0    codetools_0.2-16  
## [37] ellipsis_0.3.1     units_0.6-7        assertthat_0.2.1   KernSmooth_2.23-17
## [41] stringi_1.5.3      lwgeom_0.2-5       crayon_1.3.4.9000
michaeldorman commented 
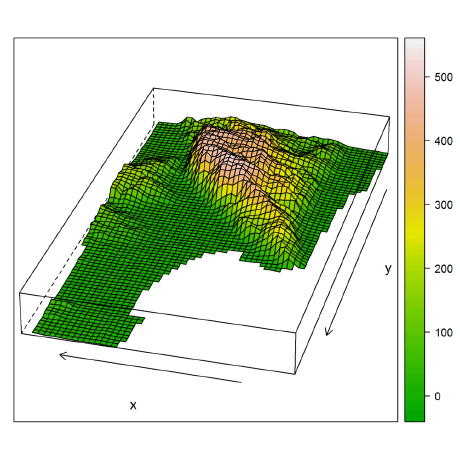
3 years ago

P.S. Here is a screenshot from QGIS, after conversion to polygons with st_as_sf, where I can see that the georeferencing in the above approach is apparently correct (this is a file from a different date of the same satellite product):

Screenshot from 2020-11-18 14-54-32

edzer commented 3 years ago

Downloading the file you point to gives me a timeout.

attr(r, "dimensions")[["x"]][["values"]][1:5, 1:5] only shows the top-left corner, you'd need all(is.na(attr(r, "dimensions")[["x"]][["values"]])) to verify they are all NA.

michaeldorman commented 3 years ago

Thanks for looking into this!

Sorry, I changed the URL, it should work now.

Good idea, thanks! I was under the impression that all coordinate values must be non-NA, so assumed they are all NA (due to an error in the data or import process). However, some of the values are indeed non-NA:

mean(is.na(attr(r, "dimensions")[["x"]][["values"]]))
## [1] 0.9327838
mean(is.na(attr(r, "dimensions")[["y"]][["values"]]))
## [1] 0.9327838

In any case (before applying the workaround), the fact that some coordinates are NA leads to issues, such as not being able to plot the layer or NA in polygon coordinates when using st_as_sf:

plot(r, axes = TRUE)
## Error in plot_sf(x, ...): NA value(s) in bounding box. Trying to plot empty geometries?
st_as_sf(r)
## Simple feature collection with 60306 features and 1 field
## geometry type:  POLYGON
## dimension:      XY
## bbox:           xmin: NA ymin: NA xmax: NA ymax: NA
## geographic CRS: WGS 84
## First 10 features:
##    2020-08-21                       geometry
## 1    1820.257 POLYGON ((NA NA, NA NA, NA ...
## 2    1766.621 POLYGON ((NA NA, NA NA, NA ...
## 3    1763.214 POLYGON ((NA NA, NA NA, NA ...
## 4    1749.186 POLYGON ((NA NA, NA NA, NA ...
## 5    1758.973 POLYGON ((NA NA, NA NA, NA ...
## 6    1768.489 POLYGON ((NA NA, NA NA, NA ...
## 7    1783.202 POLYGON ((NA NA, NA NA, NA ...
## 8    1771.817 POLYGON ((NA NA, NA NA, NA ...
## 9    1818.070 POLYGON ((NA NA, NA NA, NA ...
## 10   1789.541 POLYGON ((NA NA, NA NA, NA ...
edzer commented 3 years ago

It seems you get something useful when you try

r = read_stars(filename, sub = "/PRODUCT/methane_mixing_ratio", 
    curvilinear = c("/PRODUCT/longitude", "/PRODUCT/latitude"))

i.e. using sub and curvilniear with subdatasets relative to filename.

I find this also confusing. Your earlier attempts should obviously lead to some useful error message, rather than nonsense geometries.

michaeldorman commented 3 years ago

This works, I'll keep in mind the "relative to filename". Thank you very much!

library(stars)

# Get data
url = "https://www.dropbox.com/s/1ekgne0mklt0trh/S5P_OFFL_L2__CH4____20200821T100143_20200821T114312_14798_01_010302_20200823T193105.nc?dl=1"
filename = tempfile(fileext = ".nc")
download.file(url, filename)

# Read
r = read_stars(
  filename, 
  sub = "/PRODUCT/methane_mixing_ratio", 
  curvilinear = c("/PRODUCT/longitude", "/PRODUCT/latitude")
)
## /PRODUCT/longitude, 
## /PRODUCT/latitude, 
## /PRODUCT/methane_mixing_ratio,
r
## stars object with 3 dimensions and 1 attribute
## attribute(s):
##  methane_mixing_ratio 
##  Min.   :1512         
##  1st Qu.:1866         
##  Median :1922         
##  Mean   :1904         
##  3rd Qu.:1942         
##  Max.   :2029         
##  NA's   :836889       
## dimension(s):
##      from   to         offset delta  refsys point
## x       1  215             NA    NA  WGS 84    NA
## y       1 4173             NA    NA  WGS 84    NA
## time    1    1 2020-08-21 UTC    NA POSIXct    NA
##                                       values x/y
## x     [215x4173] -179.988 [°],...,179.99 [°] [x]
## y    [215x4173] -88.6709 [°],...,89.9821 [°] [y]
## time                                    NULL    
## curvilinear grid
edzer commented 3 years ago

In your initial example there was a critical warning that you ignored; I now turned this one into an error. A full reprex including the two correct approaches to use curvilinear and the error message follows:

ibrary(stars)
# Loading required package: abind
# Loading required package: sf
# Linking to GEOS 3.8.1, GDAL 3.1.3, PROJ 7.1.1
filename = "S5P_OFFL_L2__CH4____20200821T100143_20200821T114312_14798_01_010302_20200823T193105.nc"

# Read
sd = gdal_subdatasets(filename)
label = sapply(sd, function(x) gsub(".*/", "", x))
sd_values = sd[label == "methane_mixing_ratio"][[1]]
sd_lon = sd[label == "longitude"][[1]]
sd_lat = sd[label == "latitude"][[1]]
# Good:
read_stars(filename, sub = "/PRODUCT/methane_mixing_ratio", curvilinear = c("/PRODUCT/longitude", "/PRODUCT/latitude"))
# /PRODUCT/longitude, 
# /PRODUCT/latitude, 
# /PRODUCT/methane_mixing_ratio, 
# stars object with 3 dimensions and 1 attribute
# attribute(s):
#  methane_mixing_ratio 
#  Min.   :1512         
#  1st Qu.:1866         
#  Median :1922         
#  Mean   :1904         
#  3rd Qu.:1942         
#  Max.   :2029         
#  NA's   :836889       
# dimension(s):
#      from   to         offset delta  refsys point
# x       1  215             NA    NA  WGS 84    NA
# y       1 4173             NA    NA  WGS 84    NA
# time    1    1 2020-08-21 UTC    NA POSIXct    NA
#                                       values x/y
# x     [215x4173] -179.988 [°],...,179.99 [°] [x]
# y    [215x4173] -88.6709 [°],...,89.9821 [°] [y]
# time                                    NULL    
# curvilinear grid
# There were 14 warnings (use warnings() to see them)

# Alternative:
lon = read_stars(sd_lon)
# Warning messages:
# 1: In CPL_read_gdal(as.character(x), as.character(options), as.character(driver),  :
#   GDAL Message 1: The dataset has several variables that could be identified as vector fields, but not all share the same primary dimension. Consequently they will be ignored.
# 2: In CPL_read_gdal(as.character(x), as.character(options), as.character(driver),  :
#   GDAL Message 1: The dataset has several variables that could be identified as vector fields, but not all share the same primary dimension. Consequently they will be ignored.
# 3: In CPL_read_gdal(as.character(x), as.character(options), as.character(driver),  :
#   GDAL Message 1: The dataset has several variables that could be identified as vector fields, but not all share the same primary dimension. Consequently they will be ignored.
# 4: In CPL_read_gdal(as.character(x), as.character(options), as.character(driver),  :
#   GDAL Message 1: The dataset has several variables that could be identified as vector fields, but not all share the same primary dimension. Consequently they will be ignored.
lat = read_stars(sd_lat)
# Warning messages:
# 1: In CPL_read_gdal(as.character(x), as.character(options), as.character(driver),  :
#   GDAL Message 1: The dataset has several variables that could be identified as vector fields, but not all share the same primary dimension. Consequently they will be ignored.
# 2: In CPL_read_gdal(as.character(x), as.character(options), as.character(driver),  :
#   GDAL Message 1: The dataset has several variables that could be identified as vector fields, but not all share the same primary dimension. Consequently they will be ignored.
# 3: In CPL_read_gdal(as.character(x), as.character(options), as.character(driver),  :
#   GDAL Message 1: The dataset has several variables that could be identified as vector fields, but not all share the same primary dimension. Consequently they will be ignored.
# 4: In CPL_read_gdal(as.character(x), as.character(options), as.character(driver),  :
#   GDAL Message 1: The dataset has several variables that could be identified as vector fields, but not all share the same primary dimension. Consequently they will be ignored.
read_stars(filename, sub = "/PRODUCT/methane_mixing_ratio", curvilinear = list(x = lon, y = lat))
# /PRODUCT/methane_mixing_ratio, 
# stars object with 3 dimensions and 1 attribute
# attribute(s):
#  methane_mixing_ratio 
#  Min.   :1512         
#  1st Qu.:1866         
#  Median :1922         
#  Mean   :1904         
#  3rd Qu.:1942         
#  Max.   :2029         
#  NA's   :836889       
# dimension(s):
#      from   to         offset delta  refsys point
# x       1  215             NA    NA  WGS 84    NA
# y       1 4173             NA    NA  WGS 84    NA
# time    1    1 2020-08-21 UTC    NA POSIXct    NA
#                                         values x/y
# x     [215x4173x1] -179.988 [°],...,179.99 [°] [x]
# y    [215x4173x1] -88.6709 [°],...,89.9821 [°] [y]
# time                                      NULL    
# curvilinear grid
# Warning messages:
# 1: In CPL_read_gdal(as.character(x), as.character(options), as.character(driver),  :
#   GDAL Message 1: The dataset has several variables that could be identified as vector fields, but not all share the same primary dimension. Consequently they will be ignored.
# 2: In CPL_read_gdal(as.character(x), as.character(options), as.character(driver),  :
#   GDAL Message 1: The dataset has several variables that could be identified as vector fields, but not all share the same primary dimension. Consequently they will be ignored.
# 3: In CPL_read_gdal(as.character(x), as.character(options), as.character(driver),  :
#   GDAL Message 1: The dataset has several variables that could be identified as vector fields, but not all share the same primary dimension. Consequently they will be ignored.
# 4: In CPL_read_gdal(as.character(x), as.character(options), as.character(driver),  :
#   GDAL Message 1: The dataset has several variables that could be identified as vector fields, but not all share the same primary dimension. Consequently they will be ignored.
# 5: ignoring unrecognized unit: 1e-9 
# 6: ignoring unrecognized unit: 1e-9 

# Error:
read_stars(sd_values, curvilinear = c(sd_lon, sd_lat))
# Error in read_stars(.x, sub = curvilinear[1], driver = driver, quiet = quiet,  : 
#   only one array present in NETCDF:"S5P_OFFL_L2__CH4____20200821T100143_20200821T114312_14798_01_010302_20200823T193105.nc":/PRODUCT/methane_mixing_ratio : cannot resolve subdataset NETCDF:"S5P_OFFL_L2__CH4____20200821T100143_20200821T114312_14798_01_010302_20200823T193105.nc":/PRODUCT/longitude
# Calls: read_stars -> adrop -> read_stars
# In addition: Warning messages:
# 1: In CPL_read_gdal(as.character(x), as.character(options), as.character(driver),  :
#   GDAL Message 1: The dataset has several variables that could be identified as vector fields, but not all share the same primary dimension. Consequently they will be ignored.
# 2: In CPL_read_gdal(as.character(x), as.character(options), as.character(driver),  :
#   GDAL Message 1: The dataset has several variables that could be identified as vector fields, but not all share the same primary dimension. Consequently they will be ignored.
# Execution halted
michaeldorman commented 3 years ago

Thank you, this makes sense