My machines can't run python, i only get tracebacks all the time. I guess this is utf8, can youjust share the utf8 codes needed for that? i can extend rconscanvas for utf8 to support that to draw graph lines and other pixel-level images #lazy
Open XVilka opened 9 years ago
My machines can't run python, i only get tracebacks all the time. I guess this is utf8, can youjust share the utf8 codes needed for that? i can extend rconscanvas for utf8 to support that to draw graph lines and other pixel-level images #lazy
@radare no need for python then - you can try bash version https://github.com/mydzor/bash-drawille
Yes, it is UTF8, you just need proper fonts installed (like for vim powerline too).
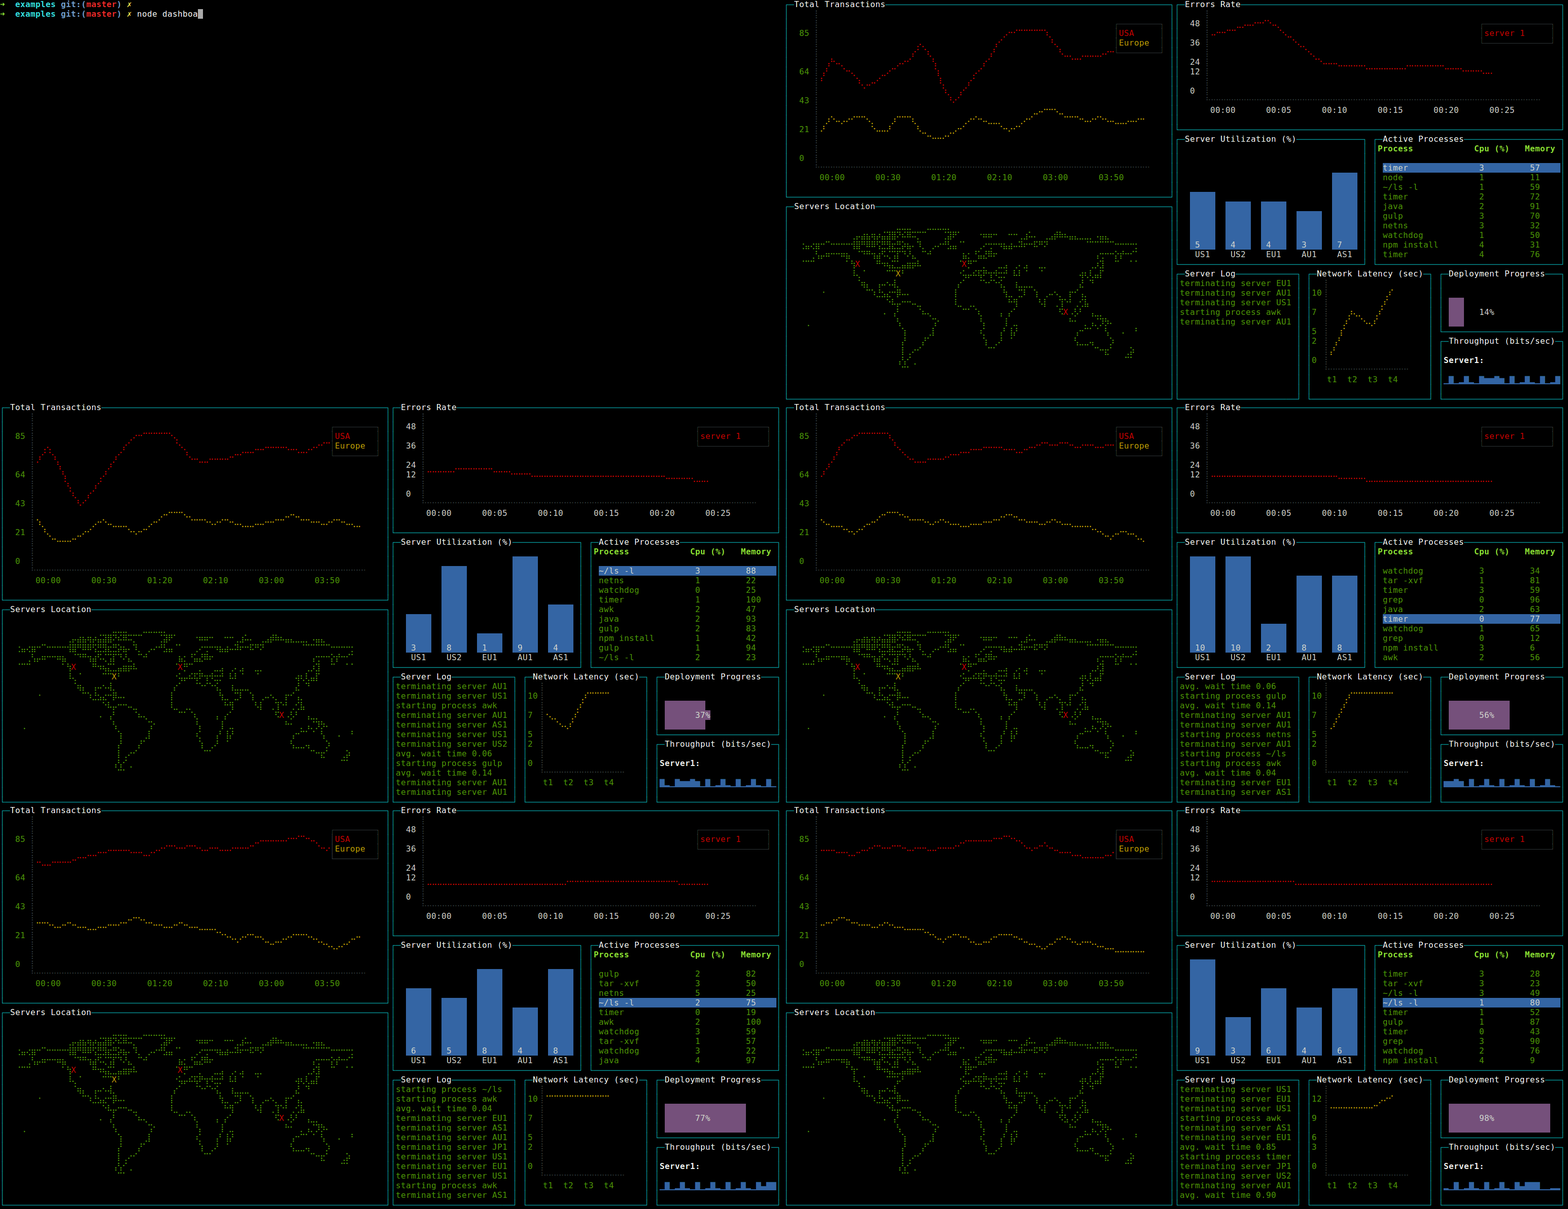
https://github.com/yaronn/blessed-contrib nodejs dashboard using this pixel stuff
It is nice, but... really? Can we close it? I don't see why radare2 should support this.
Because it gives better graphics in the console, and because SIXEL standard is not yet popular.
Because it gives better graphics in the console, and because SIXEL standard is not yet popular.
I understand the better graphics, it is cool, but r2 is not a graphics tool, it is not gimp, it is not adobe. You don't use it to see super cool graphics, otherwise I guess you are using the wrong tool.
This issue has been moved from radareorg/radare2 to radareorg/ideas as we are trying to clean our backlog and this issue has probably been created a long while ago. This is an effort to help contributors understand what are the actionable items they can work on, prioritize issues better and help users find active/duplicated issues more easily. If this is not an enhancement/improvement/general idea but a bug, feel free to ask for re-transfer to main repo. Thanks for your understanding and contribution with this issue.
Like here: https://github.com/asciimoo/drawille