ranahanocka / MeshCNN

Convolutional Neural Network for 3D meshes in PyTorch
MIT License
1.56k stars 314 forks source link

Plot training progress #64

Open claell opened 4 years ago

claell commented 4 years ago

I'd like to plot the progress of the training and validation progress (train / test accuracy and loss) over the epochs. Is that easily achievable?

ranahanocka commented 4 years ago

Hi,

you can do it with tensorboard. Install tensorboard and tensorboardX. Then run tensorboard --logdir runs and click http://localhost:6006.

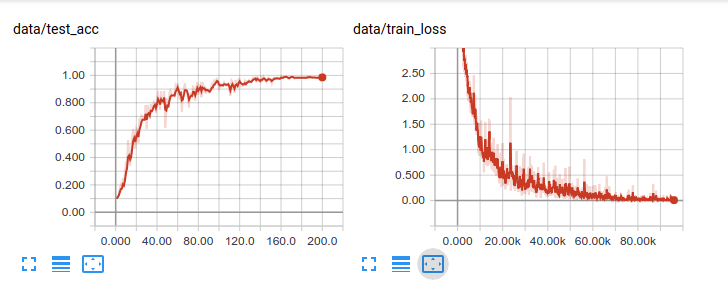
The plots for SHREC classification look like this: image

claell commented 4 years ago

Nice, I will look into it.

I am running this in the cloud on kaggle.com, so localhost won't work for me. But I will see, whether there is an option for tensorboard.

Apart from that, are there any more old-school variants that can be used with something like matplotlib available? That is, how I currently do it with Keras.

claell commented 4 years ago

There has been a Tensorboard integration available on Kaggle, unfortunately that does not seem to work currently. Also I prefer using matplotlib, since I also use it for other stuff, so the plots will be similar looking.

Where is the runs directory located that is used for the tensorboard logs? Maybe the data laying there can be used with matplotlib?

ranahanocka commented 4 years ago

Hi @claell ,

I never used Kaggle, but a quick google search pulls up this demo of tensorboard with kaggle.

If you can copy the tensorboard event data (it is in the root meshcnn directory $ROOTMESHCNN/runs). you can plot the data on tensorboard locally. Once you do that, there is an option to export to .csv , which can easily be plot with matplotlib. See this post for some more info.

I previously wrote a function to parse the csv files from tensorboard, and plot with matplotlib / seaborne. If you think it is handy, here you go:

import os
import pandas as pd
import seaborn as sns
import matplotlib.pyplot as plt

def make_fig(files, xylabels=['Iterations', 'Error']):
    colors = sns.color_palette("hls", len(files))

    fig, ax = plt.subplots()
    for fi, fname in enumerate(files):
        df = pd.read_csv(fname)
        sns.lineplot(x=df["Step"], y=df["Value"], ax=ax, color=colors[fi])

    names = [os.path.splitext(os.path.basename(f))[0].replace('_', ' ') for f in files]
    ax.legend(handles=ax.lines, labels=names, fontsize=12)
    axis_fnt_size = 20
    ax.set_xlabel(xylabels[0], fontsize=axis_fnt_size)
    ax.set_ylabel(xylabels[1], fontsize=axis_fnt_size)
    plt.show()
claell commented 4 years ago

Yes, I also found a demo and an announcement, but unfortunately that does currently not work with new notebooks: https://www.kaggle.com/product-feedback/89671#764494. However there seems to be a workaround of forking the old example that still works.

I did not find a runs folder when cancelling the training in between, so I thought it might only create it after successfully finishing. But also after a complete run I did not find it in the output files.

Basically I execute the following code:

!git clone https://github.com/ranahanocka/MeshCNN.git
!cp -r "/kaggle/input/obj-files-with-sufficient-build-volume-grouping/Mesh CNN Obj - Threshold 0.9/" "/kaggle/working/MeshCNNInput"

!python /kaggle/working/MeshCNN/train.py --dataroot "/kaggle/working/MeshCNNInput" --name "MeshCNNInput" --ncf 64 128 256 256 --pool_res 910 910 910 910 --ninput_edges 910 --norm group --resblocks 1 --flip_edges 0.2 --slide_verts 0.2 --num_aug 2 --niter_decay 100 --num_groups 2

Is it a problem that I execute the train.py without changing to its directory before?

Thanks for the plot code, that might come helpful, indeed!

claell commented 4 years ago

Is it a problem that I execute the train.py without changing to its directory before?

Apparently it is! So that should be sorted out now.

claell commented 4 years ago

However there seems to be a workaround of forking the old example that still works.

Just for info: That did not work with MeshCNN, might be caused by outdated versions of the working TensorBoard notebook.

I will use the /runs folder probably locally then.

claell commented 4 years ago

I made some progress today. I can download the /runs folder from kaggle and process it locally.

Since i might want to compare several runs, I also used some script to automatically read in the data in python without converting to csv first. The method used seems to be deprecated, though, so the process might need adjustments in the future.

Example code:

from pathlib import Path
import matplotlib.pyplot as plt
from tensorflow.python.summary.summary_iterator import summary_iterator
import numpy as np

#Paths
inputDir = 'path_to_input_files'

files = []

for filename in Path(inputDir).rglob('*.*'):
    files.append(filename)

for entry in files:
    train_loss = []
    test_accuracy = []
    for summary in summary_iterator(str(entry)):
        for v in summary.summary.value:
            if v.tag == 'data/train_loss':
                train_loss.append(v.simple_value)
            if v.tag == 'data/test_acc':
                test_accuracy.append(v.simple_value)

#Set x axis for train_loss to scale from 1 to 200
train_loss_x = np.arange(1, 200.00001, 199/(len(train_loss)-1))
plt.plot(train_loss_x, train_loss)
plt.plot(test_accuracy)
plt.show()